Category: Advanced Market Insights
Date: February 8, 2023
Category: Advanced Market Insights
Date: 2023
Author: Brian Gift, CFA — Chief Investment Officer — 704-335-4518
Take What the Market Gives Us
Every December Wall Street strategists partake in their annual ritual of forecasting where the S&P 500 will be a year from now. To be fair, this is somewhat of a thankless exercise as capital markets simply do not allow investors to be this precise. Most strategists were too conservative with their S&P 500 price targets in 2017, 2019, 2020 & 2021. Conversely, the consensus was overly optimistic in 2018 and flat out off the mark in 2022. We can’t help but point out the irony of 2020 when the global economy briefly experienced an economic depression during the second quarter due to a black swan event, yet most investors were too conservative in their forecasts for the year. In short, there will always be demand for people to predict the future, but few investors would be successful over the long term if their success was solely dependent on the accuracy of various forecasts.
In the pages to follow we have listed 23 viewpoints / themes / ideas around which we either hold a relatively high degree of conviction and / or believe are noteworthy observations for investors. We often state that as investors, we are humble and disciplined if we are nothing else. So of course, an S&P 500 target is not included anywhere in this outlook. Nonetheless we believe these themes will be useful in helping investors formulate how they may want to position portfolios on a tactical basis moving into next year. We have intentionally tried to keep most of our commentary somewhat brief, but we always enjoy discussing these topics in further detail.
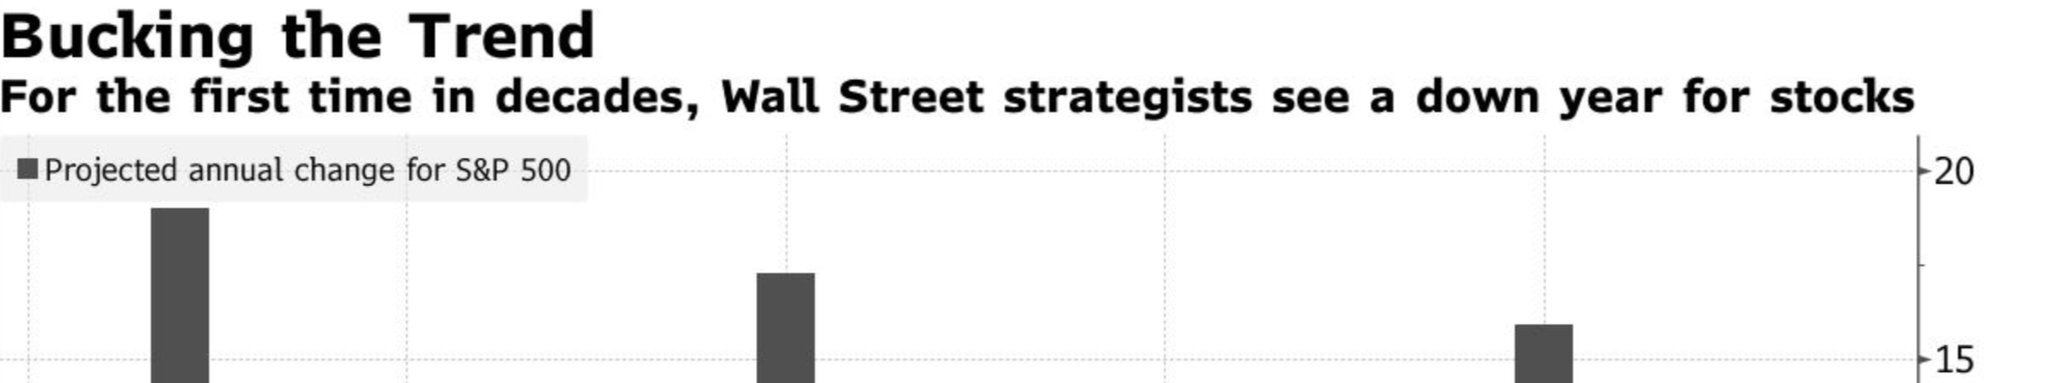
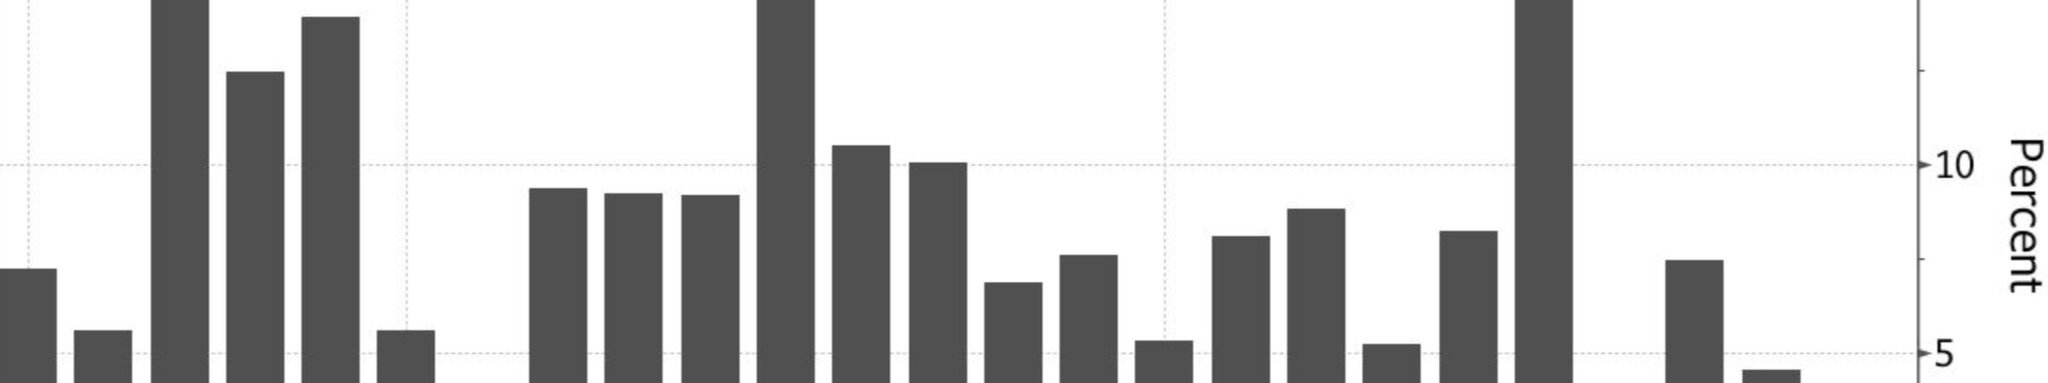
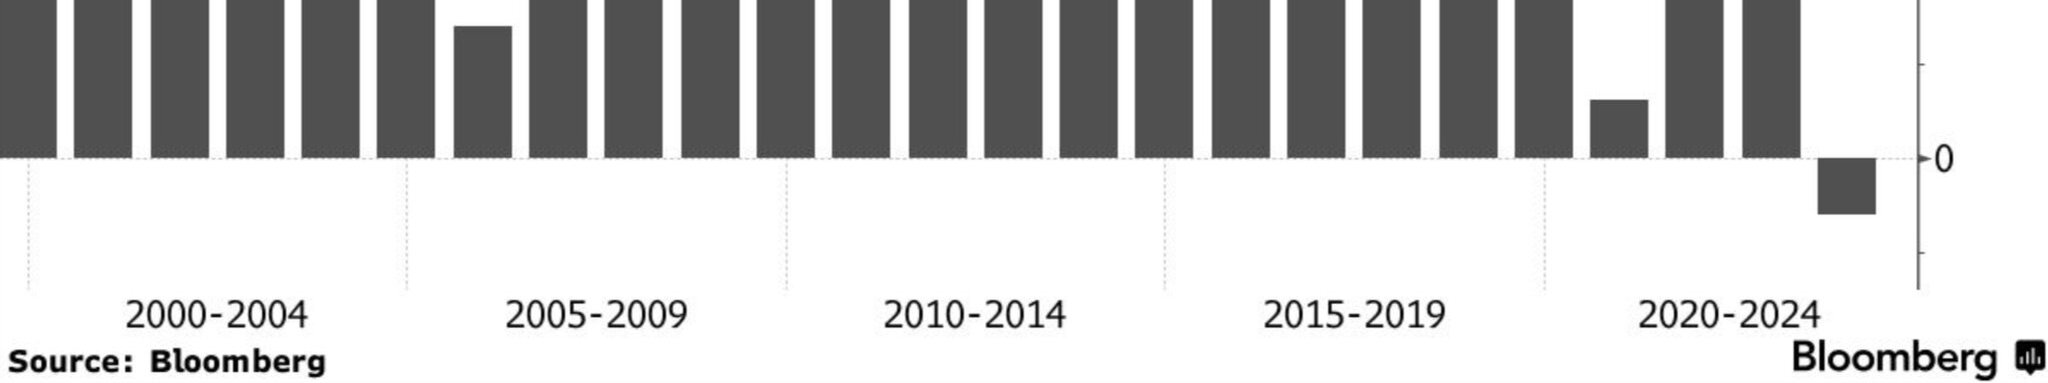
1. 16 of 17 Wall Street Forecasts Expect the S&P 500 to be Up or Down by Less Than 10% Next Year
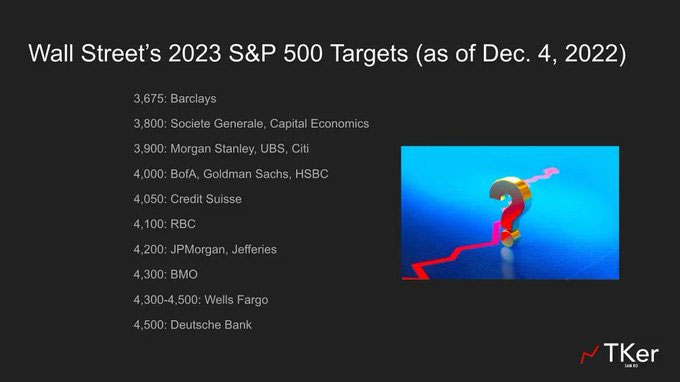
2. The Average S&P 500 Price Target for 2023 is Lower Than the Market is Today
According to our analysis, the last time the average S&P 500 price target came within 10% of actual returns (in either direction) was 2016.
3. Stocks Moving Higher to Begin 2023 and Going Lower During the Back Half of 2023 Would Be the Ultimate Pain Trade for Many Investors
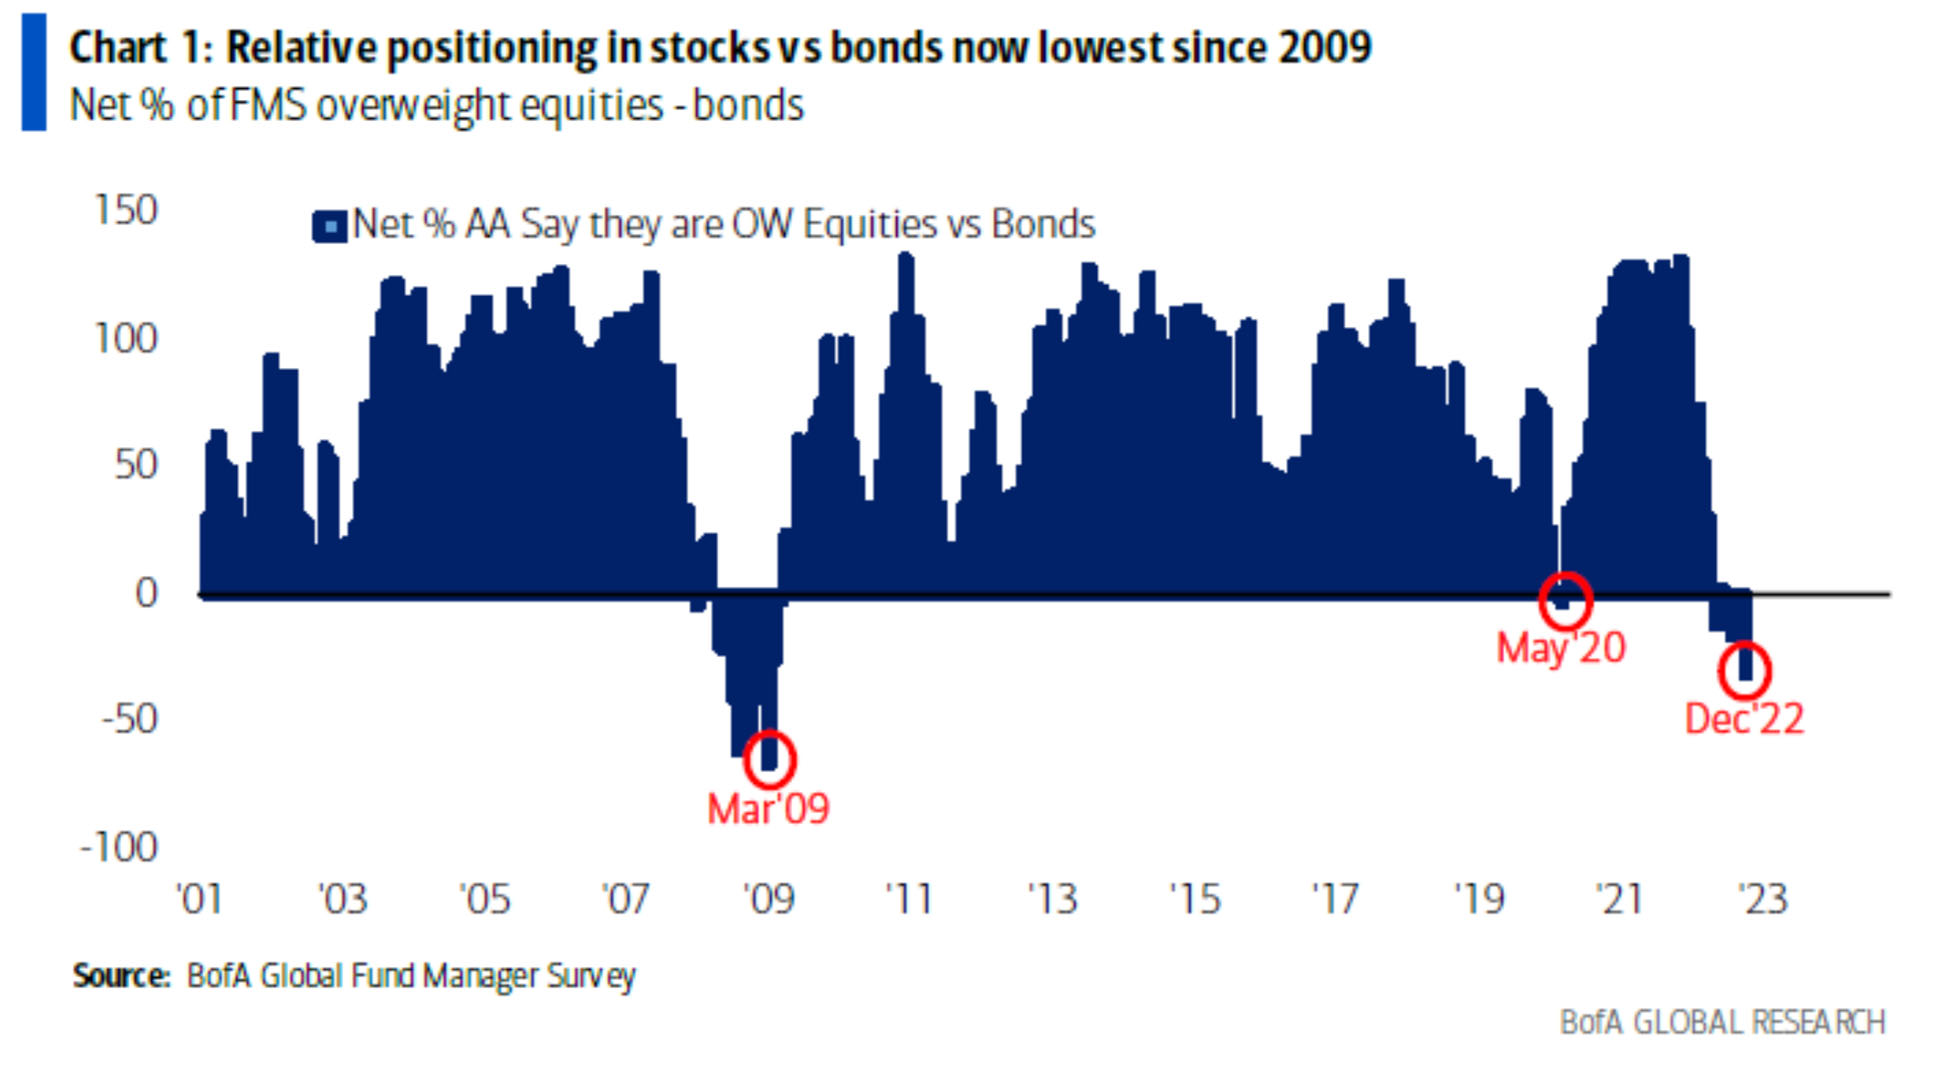
Understanding where the consensus lies is always an important aspect in formulating investment viewpoints. While we readily acknowledge that sometimes “the consensus” is correct, the vast majority of year ahead outlooks are predicting a “difficult” first half of the year, followed by a market recovery in the back half of the year. We believe the forecast for a bad 1H and good 2H is extremely consensus, and thus investors need to be on guard against this thinking. A stock market rally during the first quarter of 2023 could force many investors into chasing stocks higher. According to the Bank of America Global Fund Manager Survey, investors are more underweight equities today than they have been at any point since 2009.
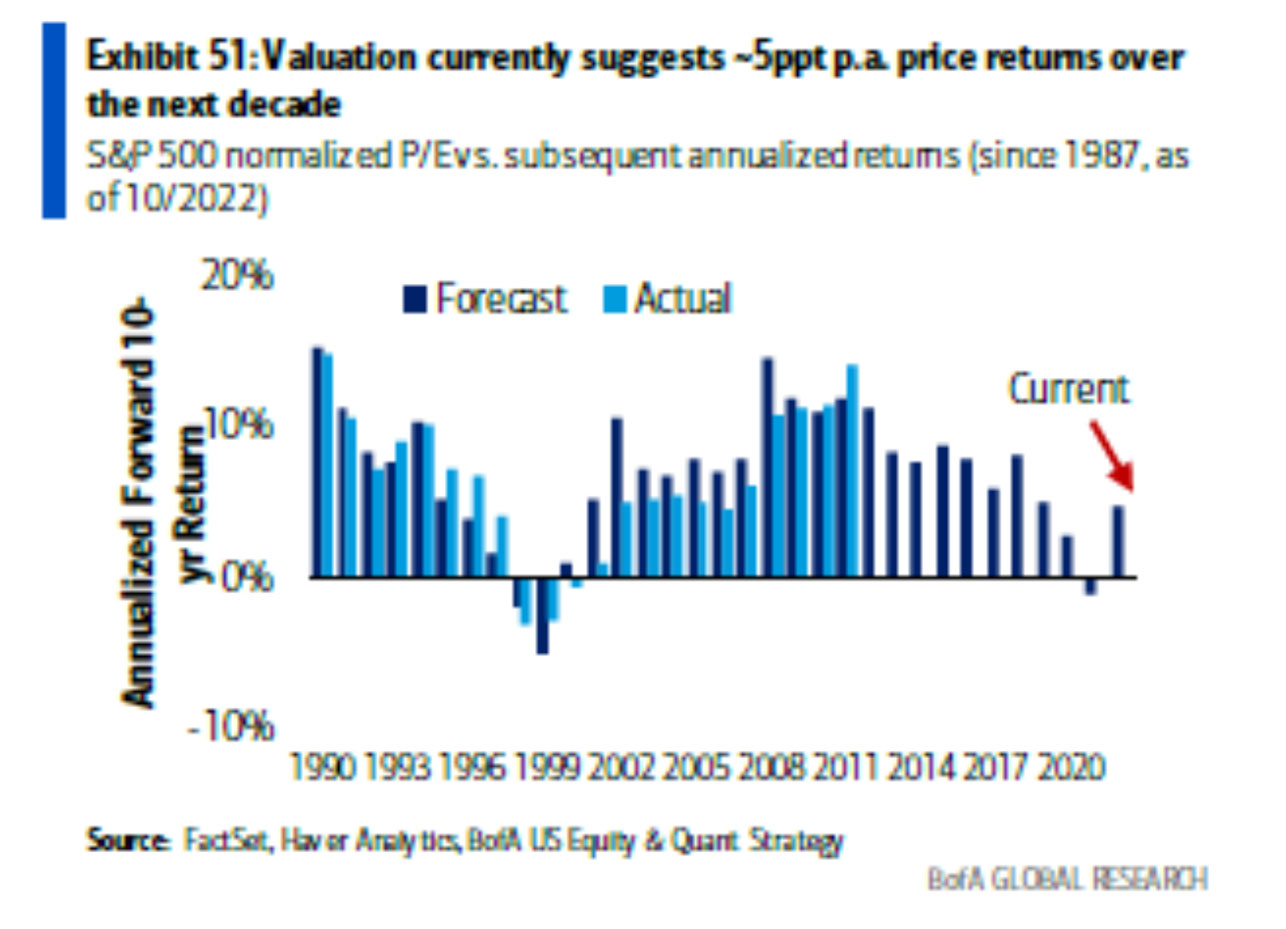
4. BofA Global Research 10 Year Forecast is for the S&P 500 to be Above 6000 in 2032
Savita Subramanian runs the Equity & Quant Strategy group for BofA Global Research and annually publishes a forecast for what investors should expect on average for S&P 500 returns over the next decade. The chart below shows that her model has an impressive historical track record. Savita’s current forecast is for 5% annual price returns which would put the S&P 500 above 6000 in 2032.
It is important to note that her forecast excludes dividend yield. If the dividend yields are added to the price returns, Savita’s forecast means the S&P would yield investors with 6.5% – 7% average annual total returns over the next decade. While humility dictates our reticence to make such an explicit forecast, we strongly agree with this narrative of returns which are below long-term historical average (9% +/-), but still attractive relative to bonds, for US Large Cap equities over the next ten years.
5. If Stocks Move Lower from Current Prices, Investors Should Increase Their Long-Term Return Assumptions
This will be an important concept to embrace since most investors agree that market volatility will likely remain elevated for the foreseeable future. The opposite is also true, if markets were to move substantially higher without fundamental justification / because of multiple expansion, investors may need to decrease their future expected returns accordingly.
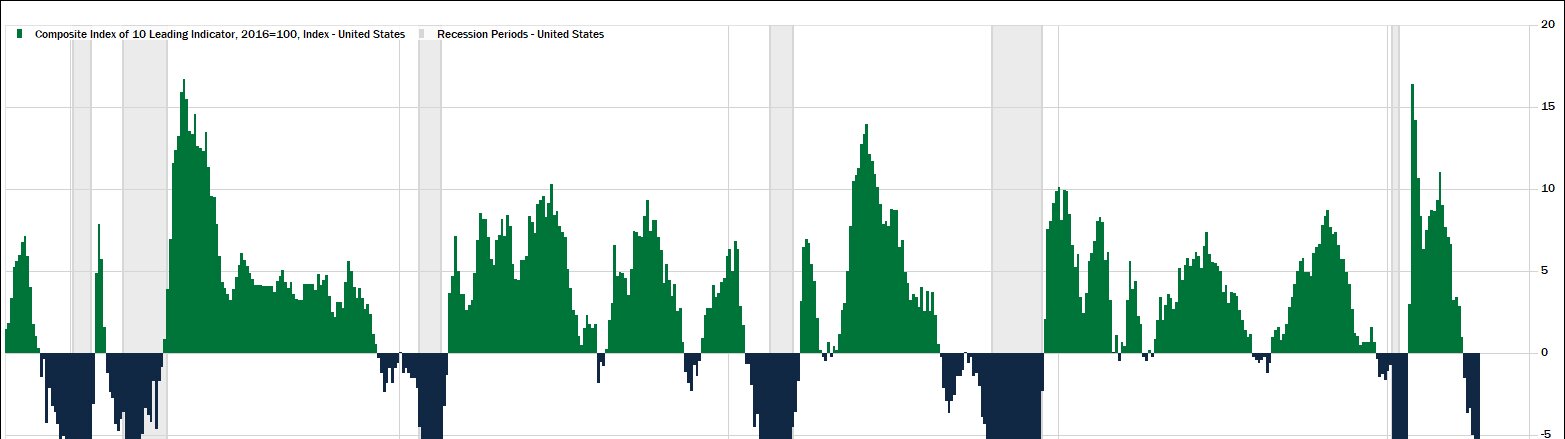
6. Recession Risks are Elevated
Yield curves are deeply inverted, Manufacturing PMI’s are decelerating, recently entering restrictive territory, the housing market is cooling at a historic pace, and US Leading Economic Indicators are negative on a year over year basis. Collectively these indicators have a strong track record of signaling recessions. Therefore, we believe the probabilities for a recession are increasingly elevated since our last writings in September.
Source: MBL Advisors & FactSet
7. If the US Economy Enters Recession in 2023, It Should be Different from the Deflationary Busts to Which We Have Become Accustomed
David Zervos of Jefferies and Barry Knapp of Ironsides Macroeconomics are both brilliant economists. They also share the rare traits of being truly original thinkers and unafraid to challenge the consensus. While most economists seem to be using a traditional playbook in forecasting a recession (or not) for 2023, Zervos and Knapp share some fascinating opinions on what they believe is in store for the US economy.
Their main point is that a recession in which real GDP contracts, but nominal growth stays positive is a very different scenario than the deflationary busts of 2001 and 2008. When deflation becomes an issue, the Fed cuts rates to 0% and possibly starts a QE program, corporate earnings collapse, and unemployment spikes. A 1970’s style recession where nominal growth stays elevated is far from an optimal environment but could be less strenuous on corporate profits vs. deflationary economic contractions.
S&P 500 Corrections & Bear Markets 1975 – 1982.
Recessions are highlighted in grey
| Peak | Trough | Drawdown | # of Days |
|---|---|---|---|
| 7/15/1975 | 9/16/1975 | -14.10% | 63 |
| 9/21/1976 | 3/6/1978 | -19.40% | 531 |
| 9/12/1976 | 3/6/1978 | -19.40% | 63 |
| 10/5/1979 | 11/7/1979 | -10.20% | 33 |
| 2/13/1980 | 3/27/1980 | -17.10% | 43 |
| 11/28/1980 | 8/12/1982 | -27.10% | 662 |
8. Although the Odds Might Be Decreasing, an Economic Soft-Landing Scenario Remains a Possibility
Myriad factors may have to line up in order for this to come to fruition, but Citi, Schwab, Goldman Sachs and Dr. Ed Yardeni are all using this as their base case scenario. Many of these research firms are discussing a “rolling recession” outcome in which various portions of the economy dip into and out of recession, but the entire economy never actually contracts in unison. Think about the housing and durable goods boom in 2020 & 2021 while the services sectors came to a grinding halt. The opposite has happened to some degree in the back half of 2022.
Don Rissmiller also points out that in order for a soft(ish) landing to occur, the Fed would need to be tolerant of inflation around 3% +/- rather than their 2.0% target. In addition, most of the damage done to the labor market would need to happen in the form of job openings being reduced rather than broad job losses.
9. Recession or Not, the US Economy Will Grow Below Long-Term Potential Growth Rates (2%+/-) for the Foreseeable Future
Don Rissmiller from Strategas Research Partners describes the purpose and effects of monetary policy more concisely than anyone else we know. He notes that monetary policy doesn’t change long term potential growth rates in an economy. However monetary policy does effectively move growth around in time – pulling future growth forward with easy policy (2020) and constraining growth below what is otherwise capable with restrictive policy. The Fed is not shy about their desires for a restrictive policy stance, and a 4.5% Federal Funds Rate certainly achieves this goal vs. their estimates for a long run neutral Fed Funds Rate of 2% – 3%.
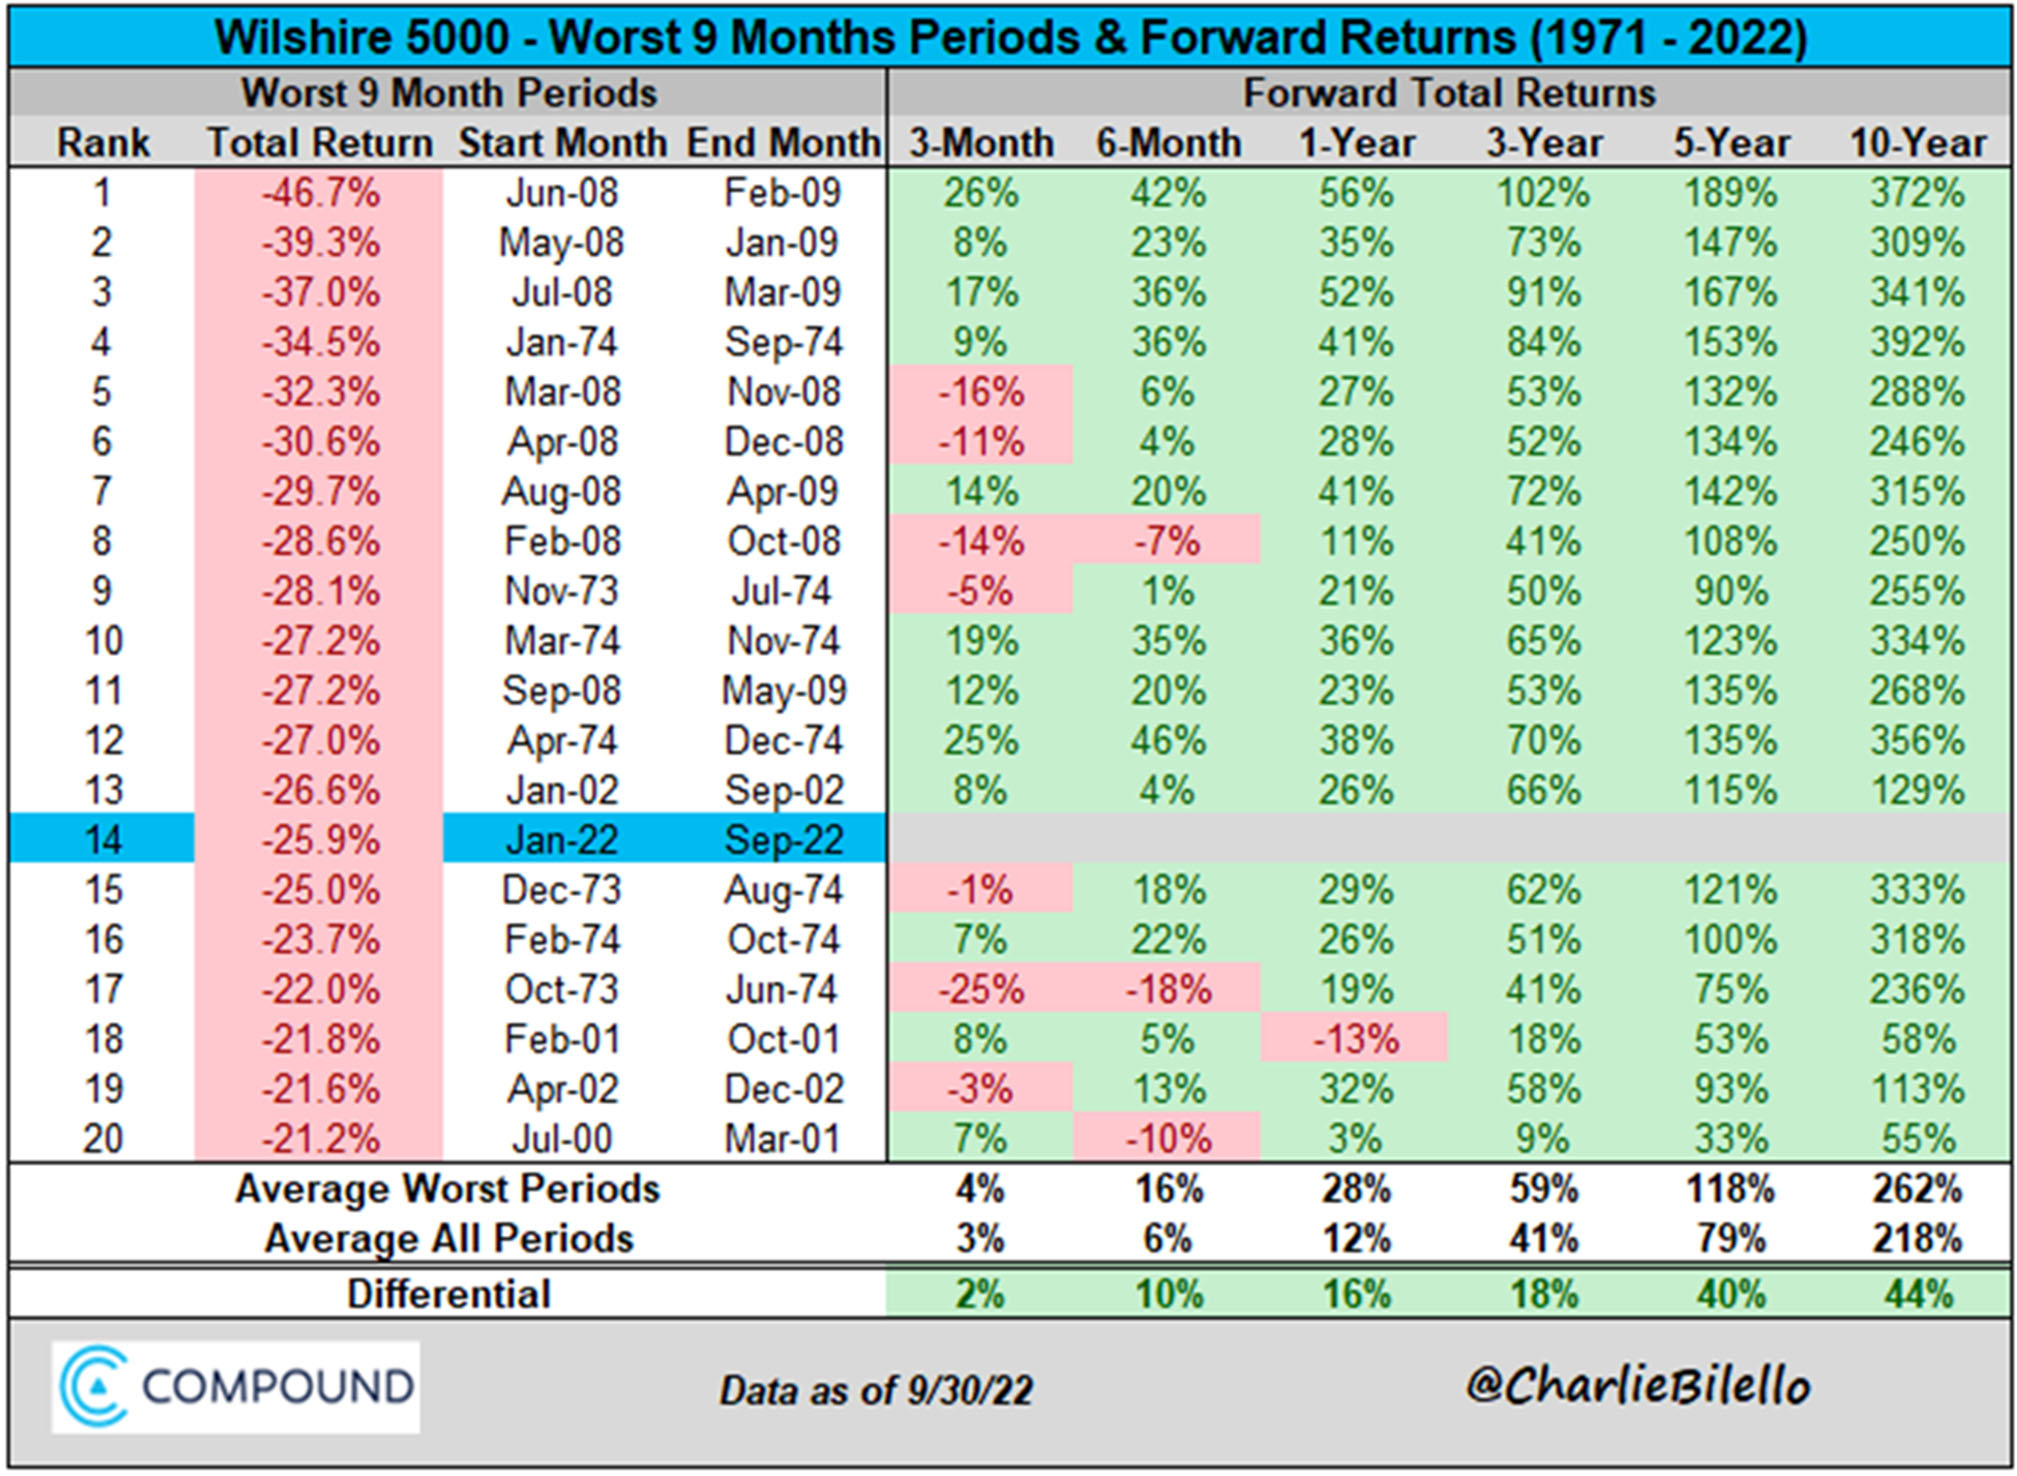
10. Recession or Not, Lots of Bad News Has Been Priced into Risk Assets
Of course this was more factual prior to the Q4 rally across most asset classes. But January 2022 – September 2022 was the 14th worst 9-month period for US equities since 1971. Forward returns and positive hit rates are very strong following these historically bad periods.
11. If There is Another Leg Down in Stocks, Contracting Earnings Will be the Primary Catalyst
We believe peak inflation and maximum Fed hawkishness are behind us and the November CPI report serves as confirmation that inflation is going to fall rather sharply in the months to come, possibly to the 4% +/- level by late spring. In other words, the inflation / interest rate bear market of 2022 has likely concluded. However, risks are plentiful for a “second act” in this bear market due to a recession and a contraction in corporate earnings.
12. Long Term Investors Should be Incremental Buyers of Stocks in an “Awful” Economy
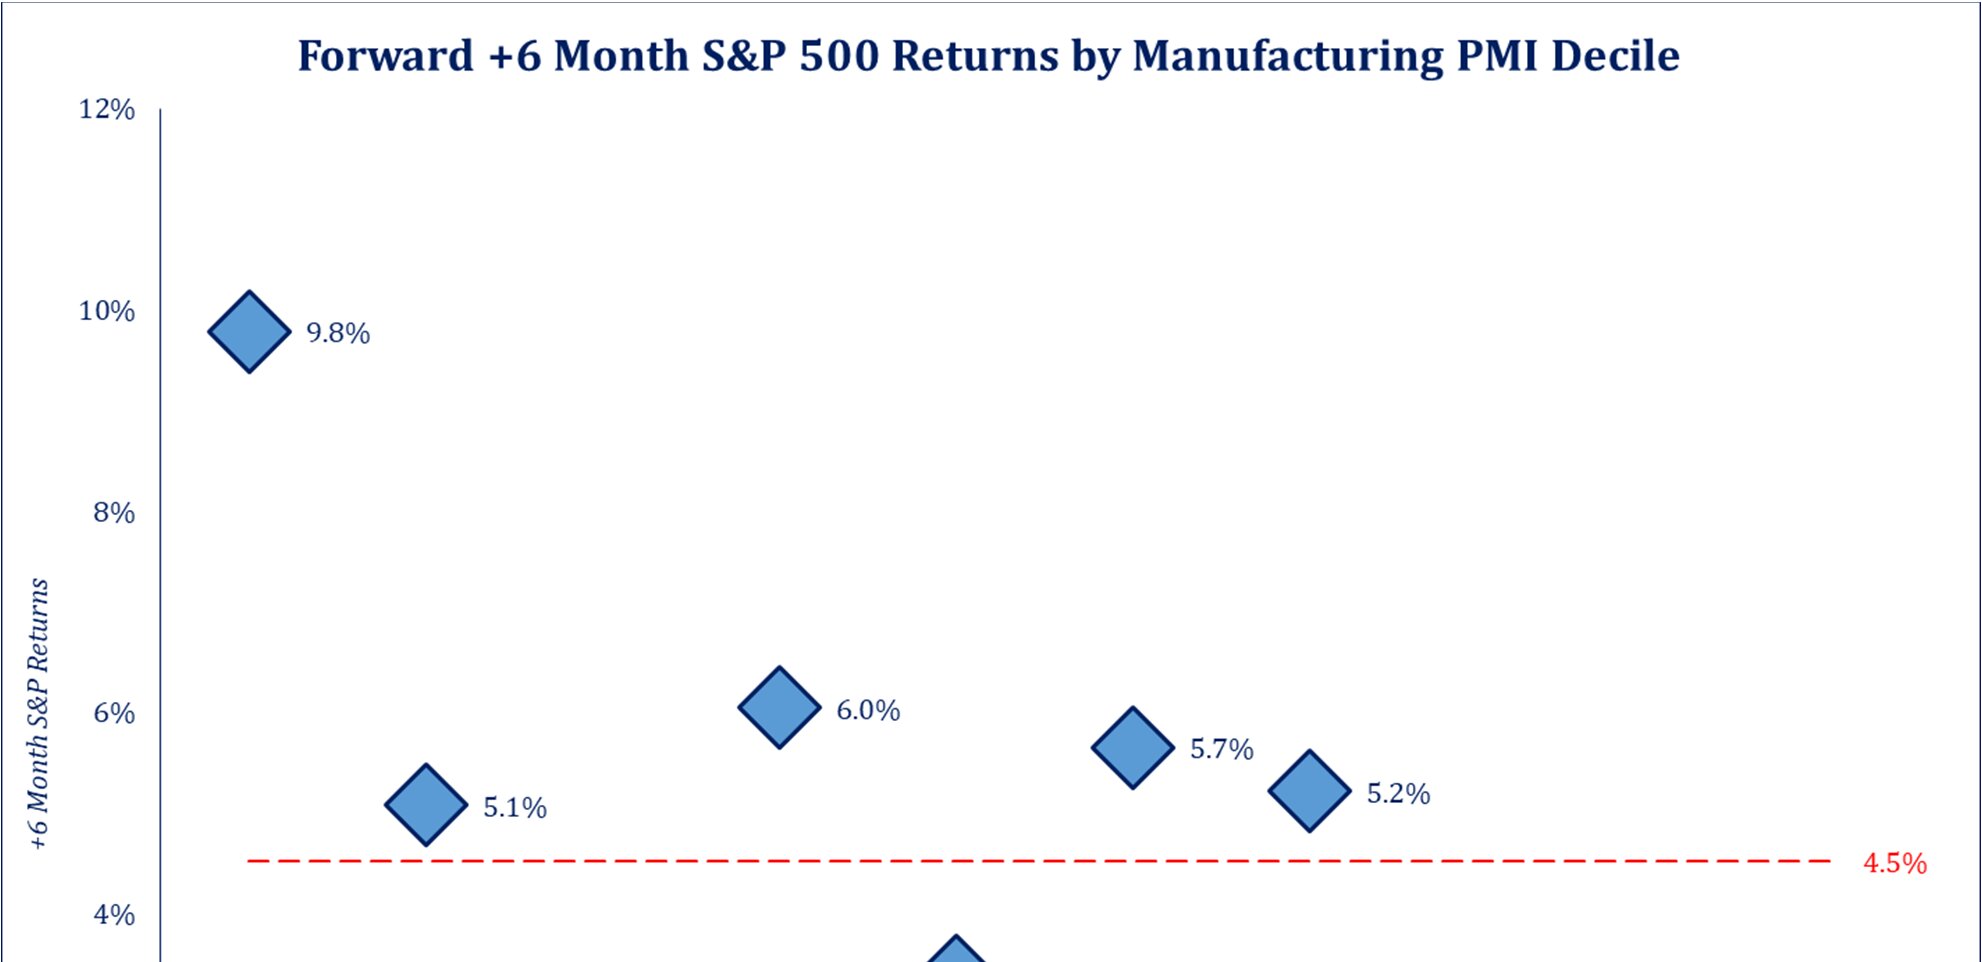
The chart below from Strategas Research Partners shows us a couple of interesting observations. First, most of the time economic data doesn’t have much of a statistical impact on forward returns for US stocks. The exception to this statement is that 6-month forward returns tend to be the worst, after the strongest PMI (manufacturing activity) readings. And 6-month forward returns tend to be the best, after the weakest PMI readings. We are currently in the second decile with no evidence of economic growth stabilizing in the near future.
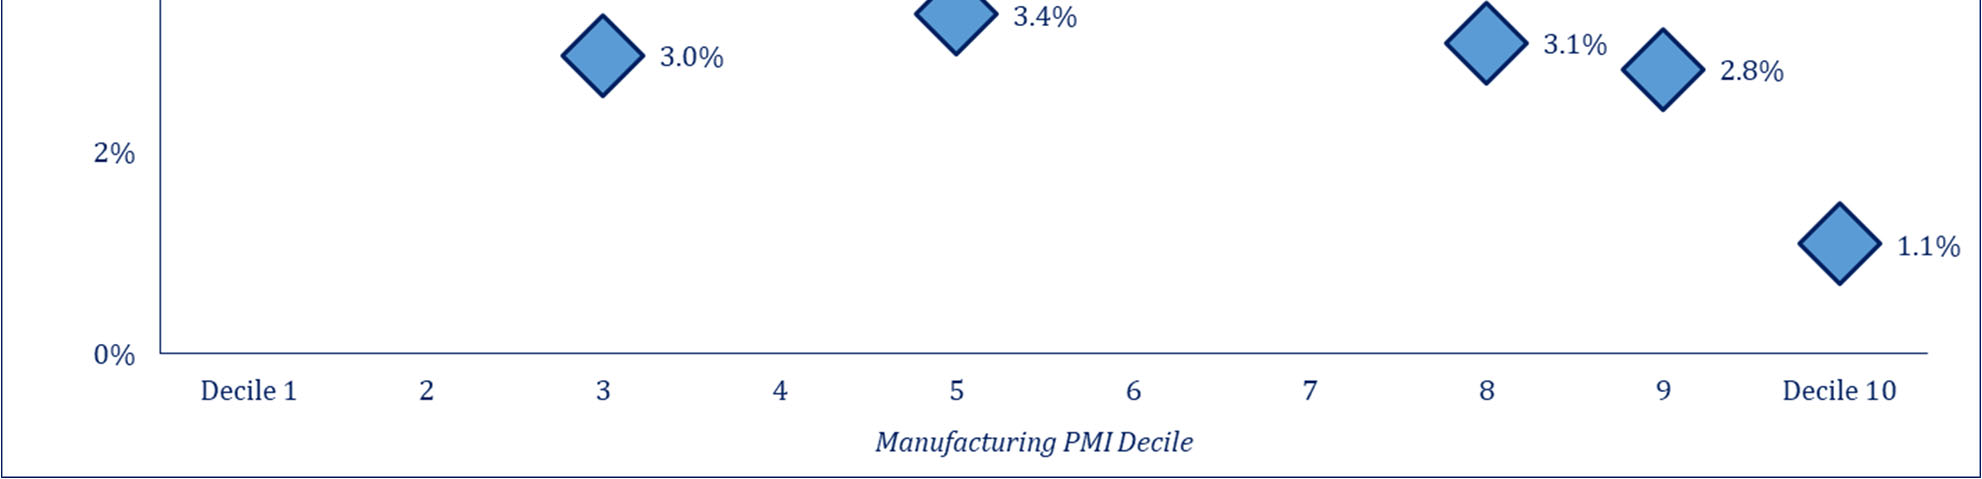
13. Buying US Equities Once They are Down -25% Has Been a Very Good Strategy for Long Term Investors
At the market lows in October, the S&P 500 was down around -26% on a closing basis. Historically, forward returns are very strong when you buy the S&P 500 down -25%, even when the market continues to go down further, which in a couple of historical instances was substantially further. To be clear, the forward returns listed in the chart below are from buying as soon as the S&P 500 hits down -25%, not from the eventual market lows.
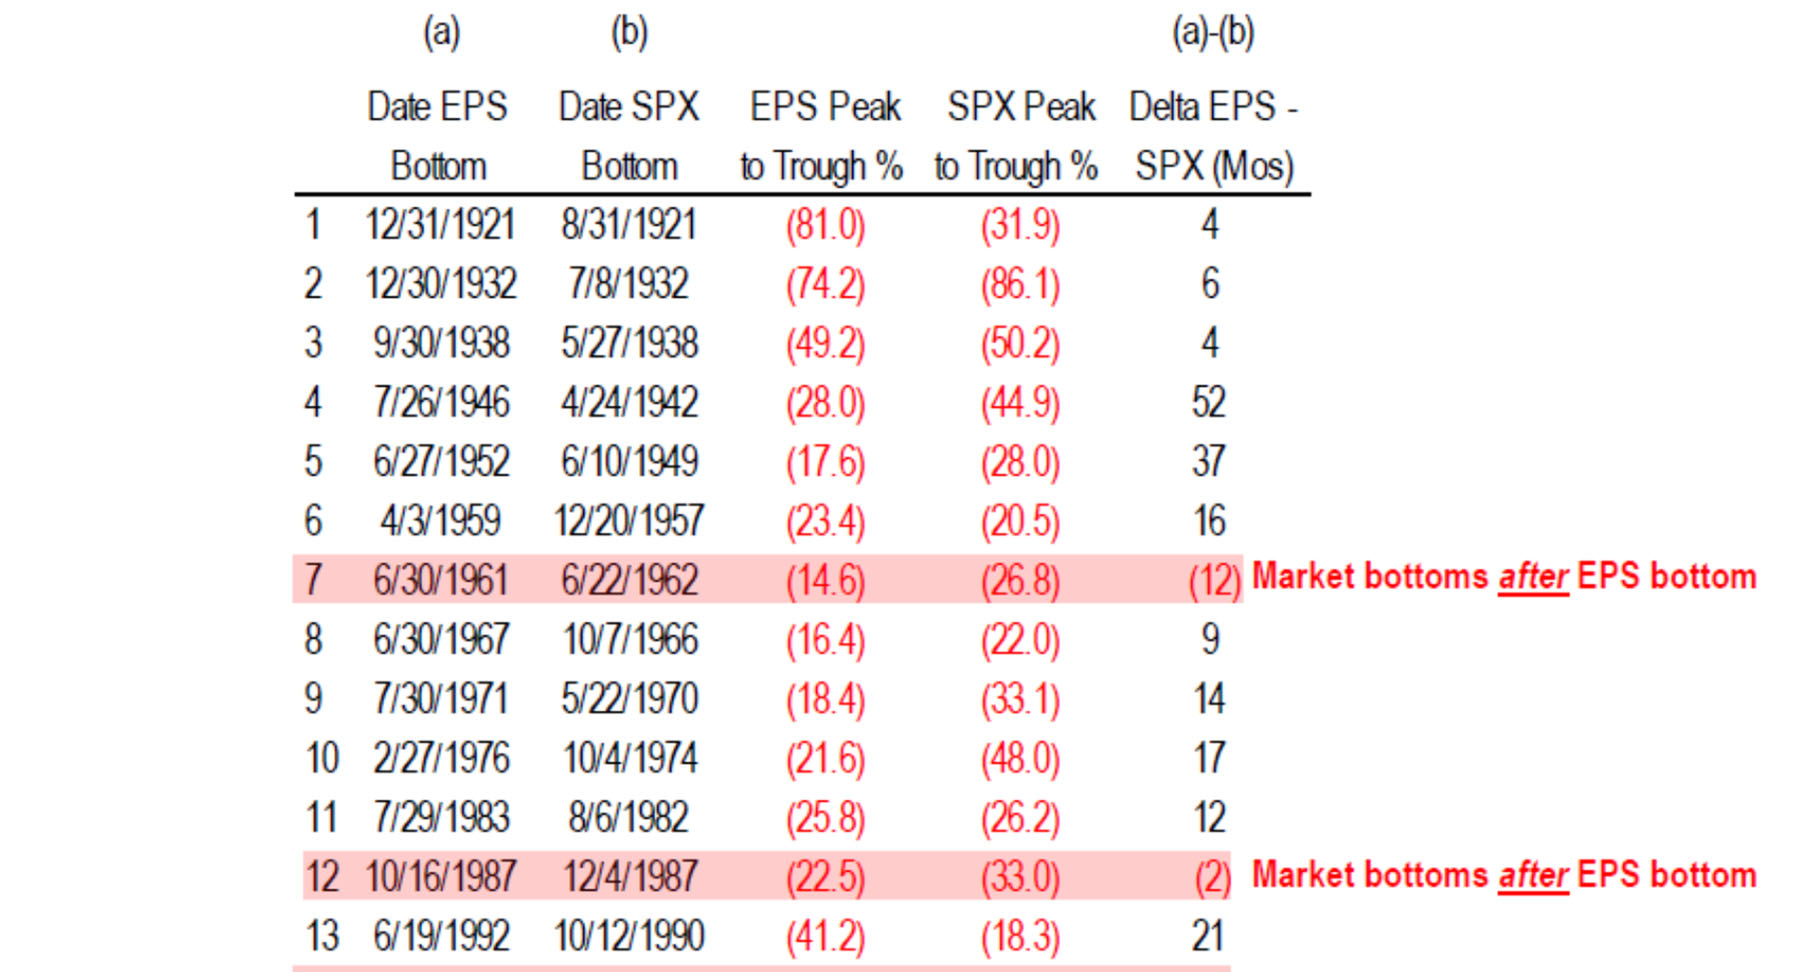
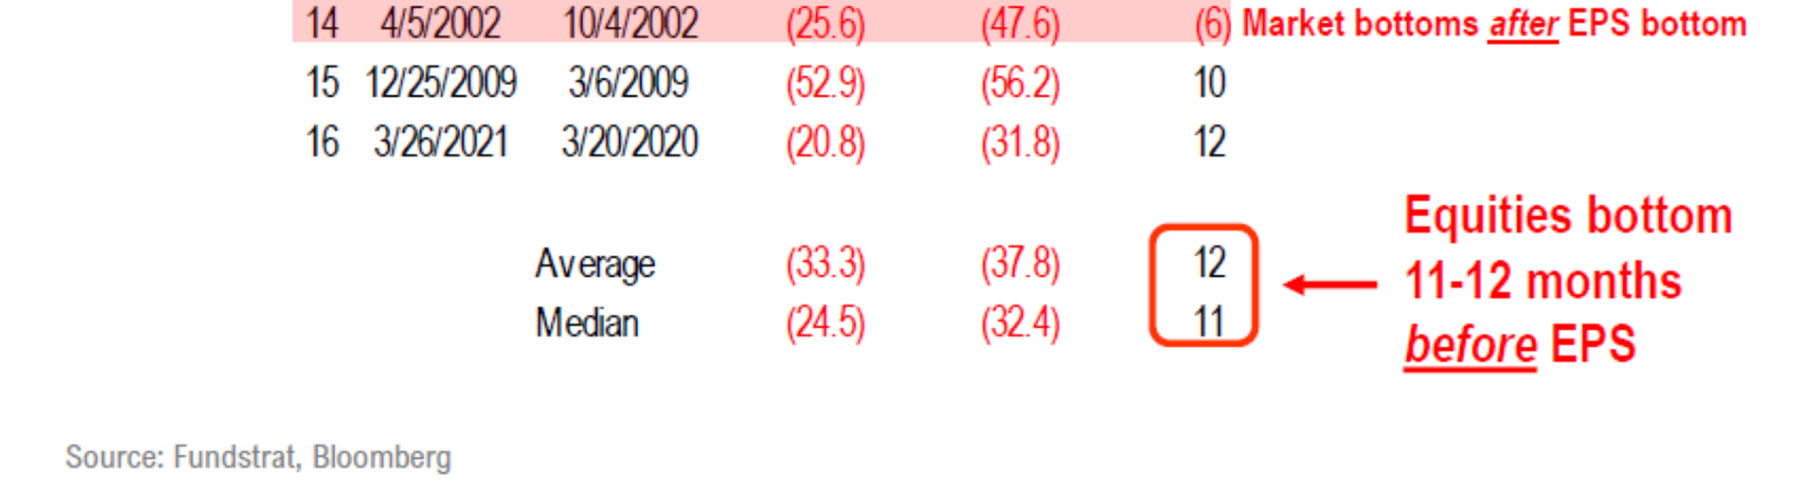
14. The Stock Market Tends to Bottom Out a Year Ahead of EPS
This is counterintuitive to most investors and is part of the reason why the initial stages of a rally coming out of a bear market are rarely trusted. But this serves as a great reminder that stocks are a leading indicator and usually bottom when things go from “awful” to “really bad” and sellers become exhausted.
Equities Have Bottomed Before EPS in 13 / 16 Recessionary Bear Markets
15. Since 1950, Historical Instances of the S&P 500 Having Negative Returns for Two Calendar Years in a Row Include the Following: 1973 & 1974, 2000 & 2001, 2001 & 2002
It is certainly possible that we are “due” for two consecutive negative years for US equity markets. But statistically, it doesn’t happen often.
S&P 500 Annual Returns (price only)
16. Fixed Income Investors Should be Excited About the Current Opportunity Set
2022 was a historically poor year for bond investors, so improvement over this threshold is a low bar. Having said this, we are willing to take things a step further to say that probabilities highly favor positive returns from investment grade bonds next year given the level of yields on high quality fixed income securities. US Treasury bonds with maturities of 10 years or less are trading their highest yields since 2007 / 2008 (source: MBL Advisors & FactSet). It was a painful process for bond investors to get to where we are now. But we finally have an interest rate environment which we have long awaited, giving investors the ability to achieve modest returns from the “safe” portion of their portfolio again.
17. There are Secular Elements Which Could Keep Inflation Elevated Relative to the Last Few Decades
Peak globalization, a shrinking labor force, global shortages of traditional energy, clean energy initiatives and an undersupply of single-family homes are some of the main drivers which could keep inflation well above the Fed’s stated 2.0% inflation target for years to come.
18. The QE Era is Over and a Different Investment Environment Will Persist Once This Bear Market is Finished
2009 – 2021 will forever be remembered as the QE Era for investors, which in our minds is somewhat synonymous to the steroid era in baseball. Certain factors simply were not in their natural state of being during this period of time, and this had broad based ramifications across capital markets. The largest factor was the artificial suppression to the cost of money, eventually leading to misallocation of capital and excessive risk taking. Therefore, as purists at heart, we welcome the reversion to fundamentals mattering as they should again.
19. Asset Class Returns for the 2020’s Could Look Much More Like the 1970’s & 2000’s Instead of the 2010’s
This has certainly been true in 2022 despite a stronger US dollar, until Q4 of this year. We continue to believe that the leaders of the next bull market will be asset classes / sectors other than the US Mega Cap Growth stocks which were the undisputed leaders of the last bull market.
20. Income Investing Will Play an Extremely Important Role in Achieving Satisfactory Total Returns During the Remainder of the 2020’s
According to the chart below from Strategas Research Partners, dividends have contributed 59.4% of S&P 500 total returns since 1930. This is in comparison to dividends accounting for roughly 26% of total returns for the S&P 500 during the 1990’s and 2010’s. Although dividend yields are lower today than they have been historically, we strongly believe that dividends will make up a much higher percentage of total returns in the years ahead relative to the past decade.
21. “Timing the Markets” Is Not Only Extremely Difficult, More Importantly It Interrupts the Power of Compounding
A client forwarded us a note from Tony Passquariello from Goldman Sachs in which he listed several interesting points. Our favorite was as follows:
if you went back to 1945 … and invested $1,000 in S&P … you would have $3mm today (a return of 3000x). if that money was only invested from May through October, you would have $10,000 today (a return of 10x). if that money was only invested from November through April, you would have $300,000 today (a return of 300x). this illustrates both the influence of the “best six months” seasonal, as well as the immense power of compounding. source: Ben Snider and Ryan Hammond, GIR.
22. Long Term Expected Return Assumptions for Diversified Portfolios Should Be Considerably Higher Today Than They Were a Year Ago
US equity market valuations are back into the realm of “normal,” and if we exclude the top 50 largest constituents in the S&P 500, valuations are in line if not below longer-term averages for many stocks. In addition, debt markets are offering investors the opportunity to achieve fairly low risk, mid-single digit returns from high quality fixed income securities for the first time in years.
Shiller P/E Ratio (green) & US Treasury 10 Year Bond Yield (blue)
23. Take What the Market Gives Us
Markets don’t always “give” great opportunities to investors, and investors may not always like the circumstances with which markets are presenting them. Having said this, the main theme of our Investment Strategy Committee meetings for the last several months has been to “take what the market gives us”. This same phrase is also the punchline to this entire strategy outlook and will be the foundation for our tactical investment decisions as we move into 2023.
The irony of this mentality is that we are stressing the fact that “we don’t know, what we don’t know.” Conversely, one thing we are keeping at the top of our minds is that the “pitches” tend to be a little “fatter” for investors during times of financial distress, which allows us the potential to be patient in waiting for high probability opportunities, when considering a 1 – 3-year investment time horizon.
Congruent with many of the items we have mentioned up to this point, the largest theme we are currently striving to accentuate within portfolios is to continue to tilt towards “yield” and “quality” across both stocks and bonds. This allows us to be “paid to wait” to some degree while we monitor markets for the possibility of some especially discernable opportunities.
15 out of 17 Wall Street strategists have year-end S&P 500 targets between 3800 – 4300 for 2023. Coincidence or not, the S&P 500 has spent most of the last 9 months trading within this range. We will be monitoring a confluence of other factors, which will serve as our predominate indicators in evaluating points in time when we want to be rebalancing portfolios, but slightly below the bottom end of this range and towards the top end of this range likely serve decent starting points within this framework.
In closing we are going to republish a few items which we wrote about in our May 2022 Investment Strategy Outlook.
The closest thing investors can realistically have to an investing superpower is to have conviction in their long-term investment strategy during times of market distress.
- To know that they have a solid financial plan and live within their means.
- To extensively understand their ability and willingness to assume market risk and to understand that their strategic asset allocation is appropriate for their goals and risk tolerance.
- To acknowledge that we know bear markets are going to happen – and our investment plan never involves properly “timing” markets to any large degree.
- To recognize that investors always “wish” for “generational” buying opportunities, although they are never obvious, and always incredibly scary once they finally appear.
- Rebalancing portfolios is an incredibly important part of the investment process, and investors need to lean into this, even when it doesn’t feel good to do so.
Being a “long term investor” when markets are going up is the easy part of the investment equation. The more important aspect of being a long-term investor is sticking to this mold when markets are going down and investing becomes more challenging. Successful long-term investing requires us to be uncomfortable in the short term on a more frequent basis than we would ideally like to be. But history tells us that markets reward investors who can successfully manage through these inevitable shorter-term obstacles.
MBL Advisors wishes you and your families a Merry Christmas and wonderful holiday season.
Sincerely,
Brian Gift, CFA
Chief Investment Officer
MBL Advisors
Bob Farrell’s 10 Investing Rules
Bob Farrell is a legendary Merrill Lynch strategist who published his timeless list of 10 investing rules several decades ago, a version of which can be found here https://www.investopedia.com/articles/fundamental-analysis/09/market-investor-axioms.asp.
It seemed some investors believed these rules were no longer as relevant as they once were when they didn’t hold true to form during the extremely abnormal bear market and subsequent recovery in 2020 and 2021. However, all of these rules seem especially pertinent today as we proceed thorough this more traditional bear market. We have written about Bob Farrell’s rules on multiple occasions in the past. But their timelessness and truth always amaze us each time we observe them.
- Rule #1. Markets tend to return to the mean over time.
- Rule #2. Excesses in one direction will lead to opposite excesses in the other direction.
- Rule #3. There are not new eras – excesses are never permanent.
- Rule #4. Exponential rapidly rising or falling markets usually go further than you think, but they do not correct by going sideways.
- Rule #5. The public buys the most at the top and the least at the bottom.
- Rule #6. Fear and greed are stronger than long-term resolve.
- Rule #7. Markets are strongest when they are broad and weakest when they narrow to a handful of blue-chip names.
- Rule #8. Bear markets have three stages – sharp down, reflexive rebound and a drawn out fundamental downtrend.
- Rule #9. When all of the experts and forecasts agree – something else is going to happen.
- Rule #10. Bull markets are more fun than bear markets.
Disclosures:
* This report was prepared by MBL Wealth, LLC and reflects the current opinion of the firm, which may change without notice. This report is for informational purposes only and is not intended to replace the advice of a qualified professional. Nothing contained herein should be considered as investment advice or a recommendation or solicitation for the purchase or sale of any security or other investment. Opinions contained herein should not be interpreted as a forecast of future events or a guarantee of future results. Different types of investments involve varying degrees of risk, and there can be no assurance that any specific investment will either be suitable or profitable for a client’s portfolio. Economic factors, market conditions, and investment strategies will affect the performance of any portfolio and there are no assurances that it will match or outperform any particular benchmark. Investments in securities involve risks, including the possible loss of principal. When redeemed, shares may be worth more or less than their original value.
* The Standard & Poor’s 500 Index (S&P 500 TR) is an index of 500 stocks chosen for market size, liquidity and industry grouping, among other factors. The S&P 500 is meant to reflect the risk /return characteristics of the large cap universe. The indices referenced herein have been selected because they are well known, easily recognized by investors, and reflect those indices that the Investment Manager believes, in part based on industry practice, provide a suitable benchmark against which to evaluate the investment or broader market described herein. Investors cannot invest directly in an index.
* Commentary regarding the returns for investment indices and categories do not reflect the performance of MBL Wealth, LLC or its clients. Historical performance results for investment indices and/or categories generally do not reflect the deduction of transaction and/or custodial charges or the deduction of an investment-management fee, the incurrence of which would have the effect of decreasing historical performance results.
* Although certain information has been obtained from sources believed to be reliable, we do not guarantee its accuracy, completeness or fairness. We have relied upon and assumed without independent verification, the accuracy and completeness of all information available from public sources. This material is not intended to present an opinion on legal or tax matters. Please consult with your investment advisor or financial planner as applicable.
* Investment Advisory Services are offered through MBL Wealth, LLC, a Registered Investment Advisor. Securities are offered through M Holdings Securities, Inc., a registered broker/dealer, member FINRA/SIPC. MBL Advisors Inc. is independently owned and operated. #5441120.2
This material and the opinions voiced are for general information only and are not intended to provide specific advice or recommendations for any individual or entity. To determine what is appropriate for you, please contact your personal advisors. Information obtained from third-party sources are believed to be reliable but not guaranteed. The tax and legal references attached herein are designed to provide accurate and authoritative information with regard to the subject matter covered and are provided with the understanding that MBL Advisors Inc., is not engaged in rendering tax, legal, or actuarial services. If tax, legal, or actuarial advice is required, you should consult your accountant, attorney, or actuary. MBL Advisors Inc., does not replace those advisors. The use of trusts involves a complex web of tax rules and regulations. You should consider the counsel of an experienced estate planning professional before implementing such strategies.
MBL Advisors Inc. is independently owned and operated. Investment Advisory Services are offered through MBL Wealth, LLC, a Registered Investment Advisor. For important information related to MBL Wealth, LLC, refer to the Client Relationship Summary (Form CRS) by navigating to http://mbl-advisors.com. Securities are offered through M Holdings Securities, Inc., a registered broker/dealer, member FINRA/SIPC. For important information related to M Holdings Securities, Inc, refer to the Client Relationship Summary (Form CRS) by navigating to https://mfin.com/m-securities. Insurance solutions are offered through MBL Advisors Inc.