Category: Advanced Market Insights
Date: January 22, 2024
Brian Gift, CFA — Chief Investment Officer — MBL Advisors
DISCIPLINE > FORECASTS
In theory, the turn in a calendar year should have no impact on market trends or leadership, yet it always amazes us how each year develops its own unique characteristics and storylines. Since COVID, the investment landscape has been unique. Various aspects of the economy seem as desynchronized as they have been at any point in modern times. We experienced the fastest stock market crash from all-time highs in history during March 2020, followed by one of the most violent bull markets ever, in part thanks to the unprecedented monetary and fiscal stimulus that was dumped into the global economy. As always, there were unintended consequences to policy makers’ outsized actions, namely a global asset bubble in 2021 followed by the highest inflation readings the developed world has experienced in over 40 years. 2022 was not a pleasant year for investors, as various asset bubbles deflated with central banks declaring war against inflation. Nevertheless, as we begin 2024, the 2022 bear market seems to have been “healthy” in many regards, as the true bubbles have collapsed (NFT’s, most crypto, Meme stocks, companies with no line of sight to profitability, long duration bonds, etc.), and central banks seem to have regained control of their price stability mandate.
To the surprise of many, the 2022 bear market stopped short of anything more dire, ultimately leading to solid gains across most asset classes in 2023. Aside from Mega Cap Technology stocks, effectively all of the gains came in the final two months of the year, as capital markets quickly changed their tone and priced in an all elusive economic “soft landing.”
In our recent conversations with clients, we have noted that this has been a particularly difficult investment environment around which to gain high levels of conviction. If one thing seems for certain, it is that public markets are now capable of moving more quickly than ever, as an increasingly large amount of volume is conducted by algorithmic, systematic, short-term traders, who pay very little attention to traditional fundamental investment approaches. Goldman Sachs noted that at the beginning of November, CTA’s had the highest levels of short positioning in US equities since 2011, which undoubtedly provided a lot of fuel to the equity rally to close out the year.
One factor that has affected all investors alike over the last few years has been the extreme volatility in interest rates. Even relatively “low risk” assets such as short to intermediate government bonds have exhibited levels of volatility which are historically rare over the last couple of years. Price movements in intermediate government bonds could be confused with small cap stocks recently, which has filtered through to the relatively sharp price movements across all asset classes. Long duration treasury bonds are inherently volatile, but at one-point last year their price decline from their peak (in 2020) was larger than the peak to trough decline in the S&P 500 from October 2007 – March 2009 (which was the worst equity bear market since the 1930’s). With the worst of the inflation battle seemingly behind us, we are hopeful that lower volatility in interest rates will lead to a more stable investment environment in the years ahead.
In the pages to follow we have outlined several observations that we believe will be useful in helping investors avoid some potential “blind spots” in the months ahead. To be clear, the “crosswinds” appear as extreme as ever, with no shortage of items for the “bulls” or “bears” to hang their hats on. With myriad contradictory factors in play, and markets immediately pricing in new information, our primary advantage will remain in extending our time horizon well beyond the short-term noise and narrative of the day. Investors always need to be prepared for a wide range of outcomes over shorter term time horizons, and we believe this is especially imperative for the year ahead.
1. The Average 2024 Year End S&P 500 Price Target is Only 2% Higher For the Year
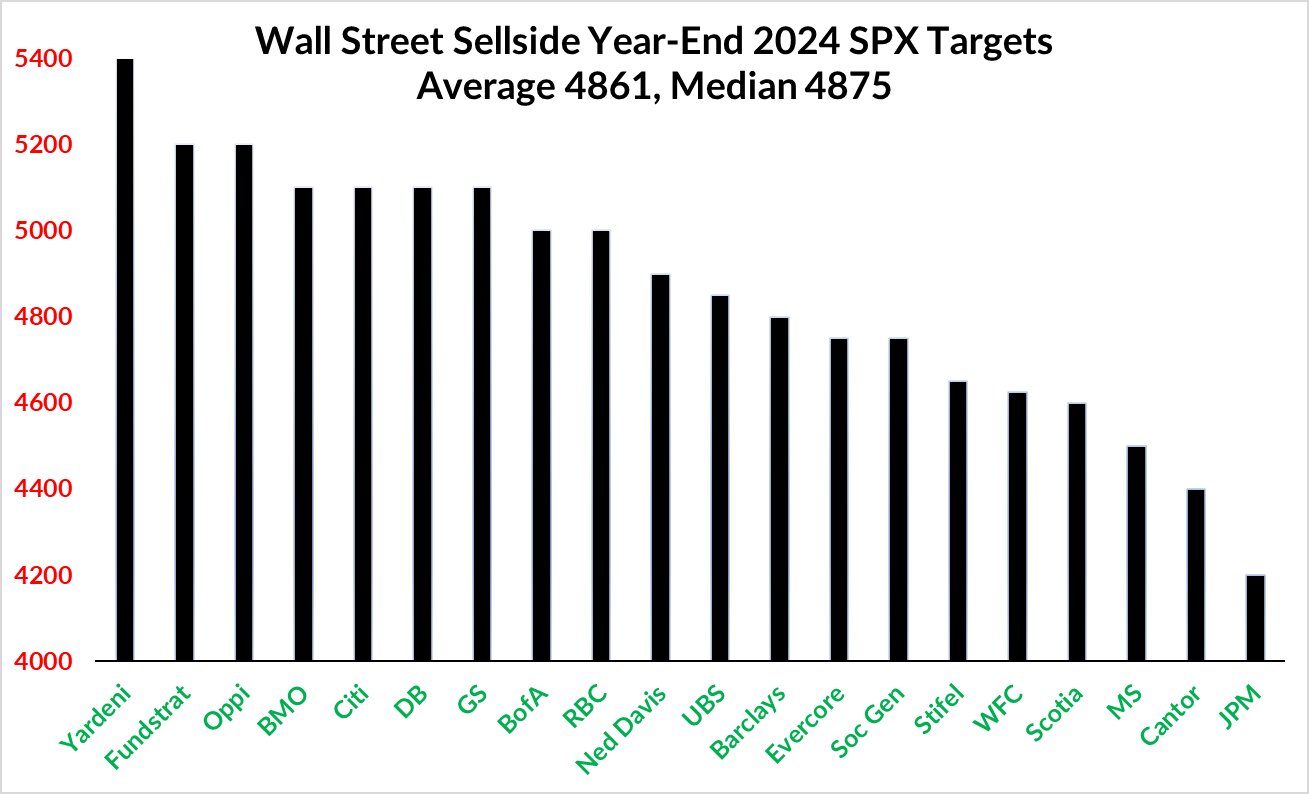
Source: Tom Lee & FSInsights
Much of Wall Street seemed to be regaining a relatively bullish tone in their 2024 outlooks when they were published in late November and early December. However, given the strong rally in equity markets to finish the year, the average strategist price target is forecasting very muted upside for US Large Cap equities in 2024. Goldman Sachs already (on December 18th) revised their original 2024 S&P 500 price target (set in November 2023) from 4700 up to 5100. Could there be more to follow? When Wall Street is cautious, it is often bullish for equity markets.
As a reminder, strategists were the most bearish they had ever been entering 2023. It was the only time in the last 25 years when the average strategist forecast was for negative returns for the S&P 500. Wall Street’s forecasts from a year ago serve as a great reminder that “predicting the future” is very difficult.
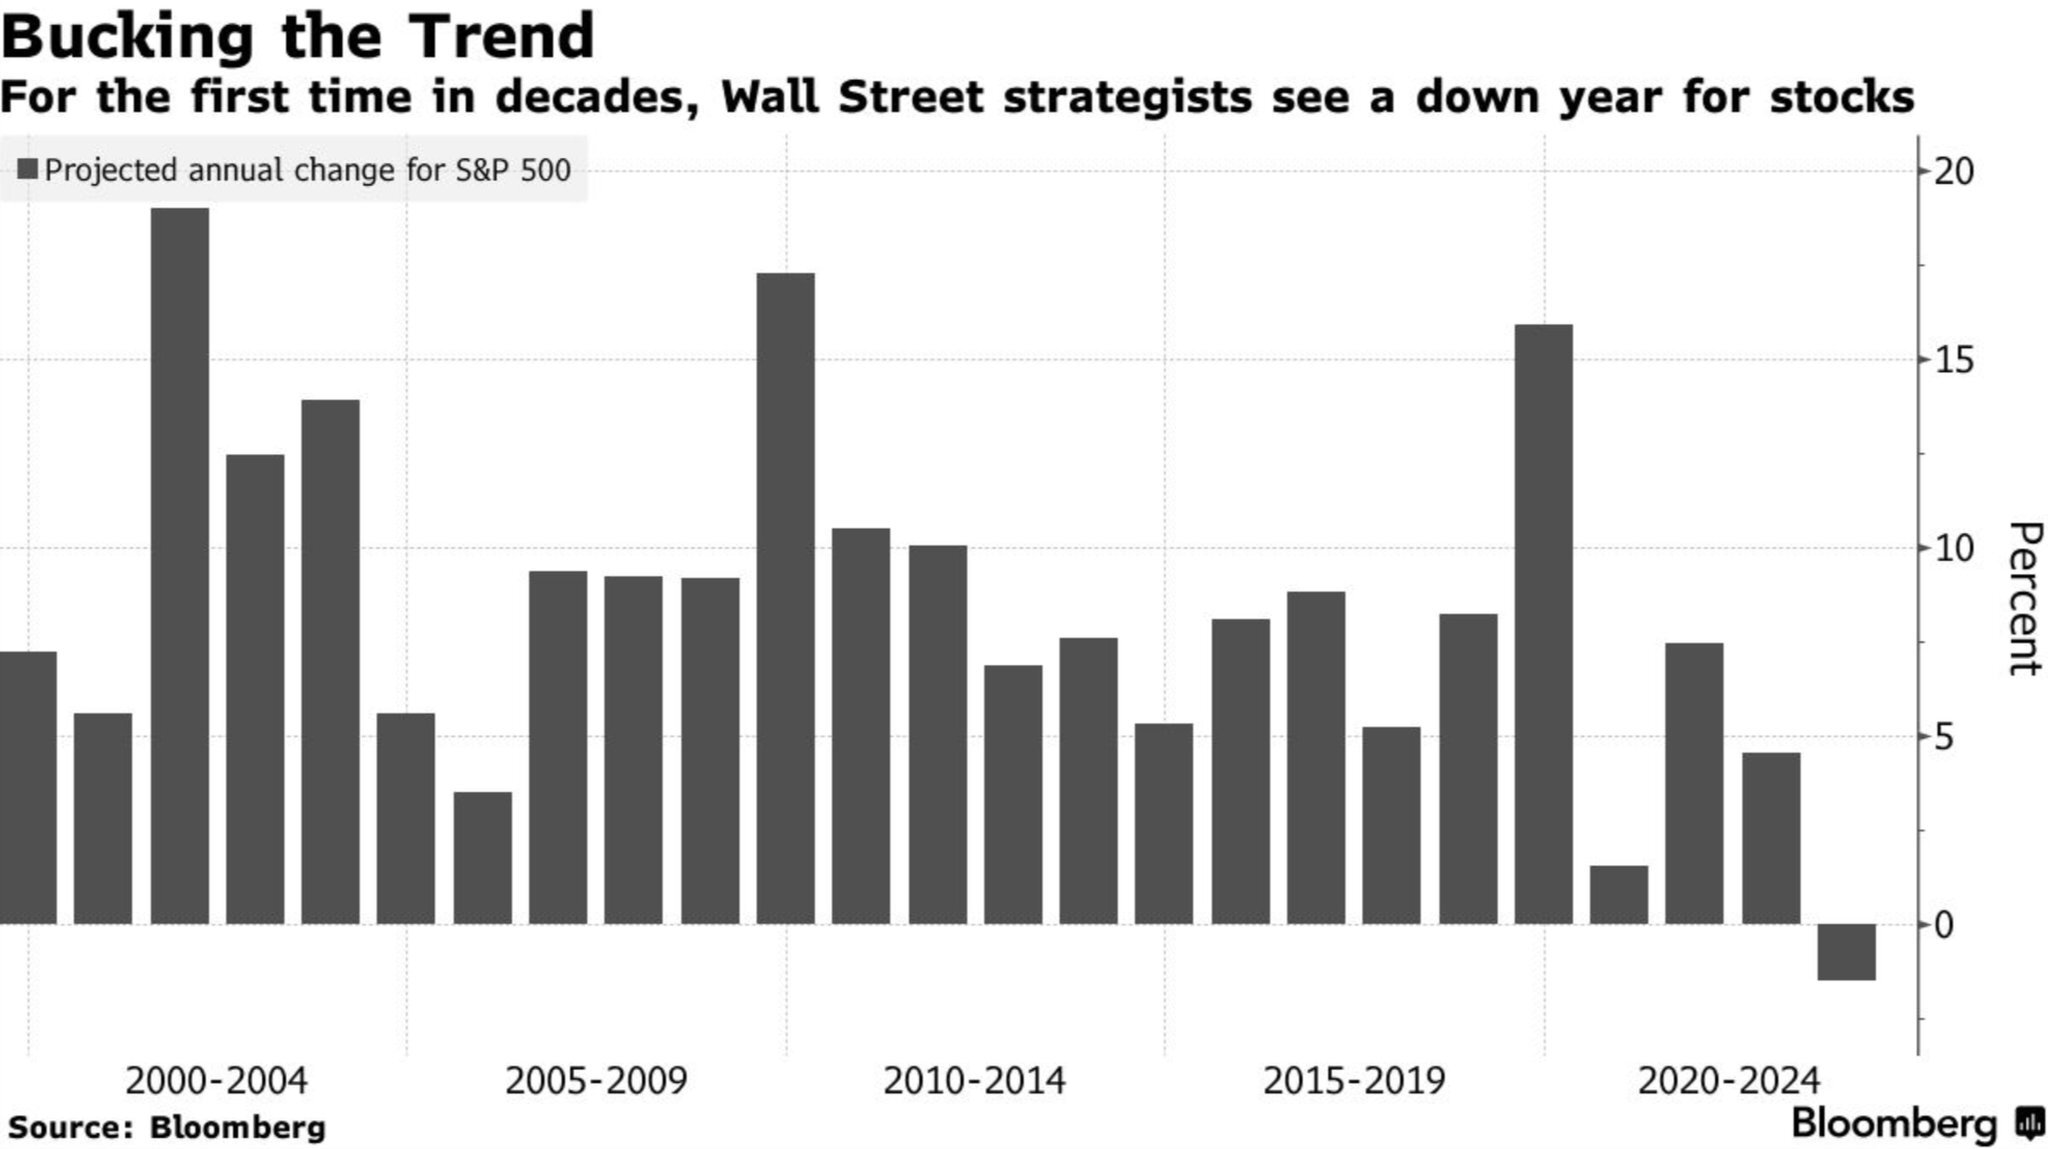
Source: Bloomberg.com
2. The Investment Climate
Dr. David Kelly from JP Morgan utilized a terrific investment analogy in his recent newsletter from 12/11/23 (Source: Dr. David Kelly: The Investment Climate). He wrote:
As winter weather envelops the homes of New England, our thoughts naturally turn to warmer days and maybe a beach house on Cape Cod. Of course, if you intend to rent such a house for a week next summer, it’s pretty much a roll of the dice. You could get lovely weather, or it could rain every day. However, if you plan to buy a beach house on Cape Cod, you really only need to understand the climate. The sunny summer days will far outnumber the wet ones.
Long term investing is like Buying, rather than renting, a beach house. The important thing is to understand the climate rather than to forecast the weather. Every December, market strategists publish their forecasts for the S&P500 for the end of the following year. Some are bullish and some are bearish. However, if we are being honest, it’s an almost impossible task. The logical construction of a year-end 2024 estimate would require an accurate short-term forecast of growth, inflation and the dollar, how these variables could impact profits and interest rates, how policy makers might respond to markets and other forces and, most importantly, how unforeseeable but inevitable shocks would impact investor sentiment and flows. Getting this right over a one-year time horizon is next to impossible.
Dr. Kelly’s words are far simpler and more elegant than anything we could produce originally. But it is a perfect narrative for how we have been describing the investment landscape for the next five plus years.
Since COVID, we are not aware of many economists who have consistently had a good pulse on the business cycle. A year ago, 85% of economists believed that a global recession was inevitable in 2023 (source: Financial Times & Ben Carlson, CFA). Despite not having this recession yet, the consensus now believes the Fed will pull off an all elusive “soft landing.” The December 2023 Bank of America Global Fund Manager Survey confirmed that the consensus is officially in the soft-landing camp – “with over 70% of participants now expecting a “soft” or “no” landing in 2024″ (source: Michael Hartnett & BofA Global Research).
Whether the global economy experiences a recession or not will likely have a substantial impact on the performance of most asset classes in 2024. At the same time, a recession unfolding or not in 2024 may have little impact on 5 year returns for most broad asset classes, aside from the sequencing of these eventual returns.
A multitude of research analysts, including Savita Subramanian from BofA Research, have written extensively to demonstrate that starting equity valuations are by far the best predictor of long-term equity market returns. This doesn’t mean they are perfect, and over shorter-term time horizons equity valuations are a useless metric for forecasting returns. But when we shift our focus beyond 2024 in isolation and think about what five-year returns might look like, we find the setup to be fairly encouraging.
| Index | NTM PE | LT Average | LT Average Horizon | Source | Date |
|---|---|---|---|---|---|
| S&P 500 | 19.5x | 15.96x | Since 2002 | MBL Advisors & FactSet | 12/31/2023 |
| S&P 500 10 Largest Stocks | 25.4x | 19.1x | Since 1990 | BMO Capital Markets ISG | 12/7/2023 |
| S&P 500 Ex 10 Largest Stocks | 15.4x | 15.9x | Since 1990 | BMO Capital Markets ISG | 12/7/2023 |
| S&P Mid Cap 400 | 14.5x | 14.19x | Since 2002 | MBL Advisors & FactSet | 12/31/2023 |
| S&P Small Cap 600 | 14.3x | 14.59x | Since 2002 | MBL Advisors & FactSet | 12/31/2023 |
| MSCI ACWI ex US | 13.1x | 12.9x | Since 2003 | JPM Guide to the Markets | 12/31/2023 |
| 10 Year Treasury Yield | 3.88% | 3.03% | Since 2002 | MBL Advisors & FactSet | 12/31/2023 |
Most equity indices, aside from the market cap weighted S&P 500, are priced in line with long-term historical averages, which could provide investors with (average) high single digit annualized returns over the next 5 to 10 years. Despite the recent rally in bond prices, bond yields generally remain more attractive than they have been at any other point over the last 15 years. In addition, JC Parents from All Star Charts, has been pounding the table to bring attention to the reality that countless (non-US) global stock market indices have recently made new 52-week highs (many of which are new all-time highs). For US investors allocating capital outside of the US, the strong US dollar has been a headwind to these returns. However, the US dollar has begun to weaken against many currencies in the last couple of months, notably against several emerging market countries. This could serve as a tailwind to non-US equities in 2024 – although we recognize that strategists seem to have been incorrectly forecasting this dynamic for several years.
3. Bearish Sentiment was a Major Tailwind for Equities in 2023. The Setup is Very Different Moving into 2024.
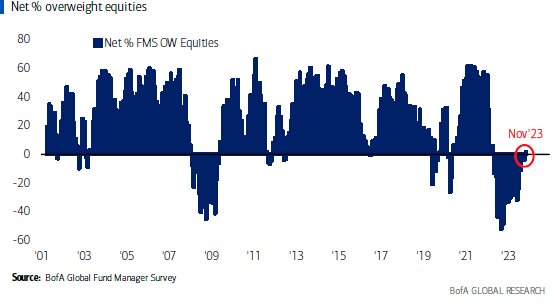
According to the Bank of America Global Fund Manager Survey, 2023 began with investors underweight equities relative to bonds, and this positioning only became more extreme as the year progressed. Last spring, investors were more underweight stocks vs. bonds than they were during the depths of the Great Financial Crisis in March 2009, according to the Global Fund Manager Survey. As of November 2023, investors moved back to a fractional overweight positioning of stocks vs. bonds, which was the first overweight reading since April 2022.
Investor sentiment is most useful when it is at an extreme, and sentiment was rapidly advancing into the direction of a bullish extreme (on some shorter-term metrics) to finish 2023. Chris Verrone from Strategas Research Partners frequently reminds us that “sentiment follows price in this business, not the other way around.” According to Strategas Research Partners, cumulative flows into US equities are extremely bullish (contrarian bearish) on a short-term basis. The 14-day RSI on the S&P 500 was at multi year highs to finish 2023, signaling extreme overbought levels. AAII % Bullish moved from 20% (end of 2022) to 53% (12/22/23). AAII % Bearish moved from 52% (end of 2022) to 21% (12/22/23). Goldman Sachs Sentiment Indicator suggests highly optimistic, “stretched” positioning. Dennis DeBusschere & 22V Research recently noted that “with the VIX sub 13, credit spreads in their 18th percentile (very tight), the S&P 500 PE over 19.5x, and investor sentiment (AAII) in its 98th percentile, the scope for further S&P gains is narrowing” (Source: MarketWatch: Inflation’s path will drive the stock market next year. Here’s one firm’s playbook). In other words, “yes” economic conditions seem to have improved relative to what was feared for most of 2023, but plenty of “good news” is now reflected across asset prices as well. Although some consolidation could be warranted during the first few months of 2024, this should not necessarily be conflated with the end of a bull market.
4. The BIG Story of 2023
As is the case with most aspects of life, financial markets have no shortage of meaningful events to help characterize various time periods. With 2023 fresh in our minds, we could reflect on a plethora of details which were noteworthy over the last year. Nonetheless, when we look back on 2023 five years from now, we suspect there will be one theme which stands apart from the rest – the emergence of generative Artificial Intelligence.
Technologists are fairly uniform in believing that AI will be a game changer for society, especially with regards to productivity levels over the next 5-10 years.
For the stock market, it was the combination of Chat GPT and Nvidia’s May 2023 earnings report which catalyzed the “AI frenzy”, most notably observed by the ferocious rally in the “Magnificent 7.”
The utter dominance of these stocks caused Strategas Research Partners to construct a new “Mag 7” sector within the S&P 500. When removing these stocks from their traditional sectors allocations, the “Mag 7” sector is more than double the size of any other sector within the S&P 500. Good or bad alike, this has left previously “diversified” indices such as the S&P 500 or NASDAQ more concentrated than ever before.
Regardless of the past, investors are now left with the task of analyzing this new “Mag 7” asset class and its investment prospects moving forward. Of course, this is anything but a simple task. But at a minimum, investors need to acknowledge that there is no historical precedent for the dominance, incredible innovation, and overall greatness of these businesses. With the benefit of hindsight, we can think of these companies as modern-day monopolies who have no boundaries for the segments in the economy for which they will operate. Jeff Bezos once famously noted that “your (profit) margin is my opportunity.”
At the same time, no shortage of “good news” has been priced into these stocks, and it will be fascinating to observe if they can continue to beat what have become exceptionally lofty expectations.
S&P 500 earnings per share should be almost exactly flat for calendar year 2023, thus making the entirety of the stock market gains for last year attributable to multiple expansion (of course this is not necessarily true on a company-by-company basis, as NVDA actually became cheaper in 2023 despite its blockbuster gains). Stocks often move on “better” or “worse” news relative to expectations, rather than outright “good” or “bad” news itself. The amount of optimism prevalent in many of these stocks can be observed by the fact that the Magnificent 7 stocks account for 29% of the market cap weighted S&P 500 while only contributing 20% of S&P 500 Earnings.
| S&P 500 Sector Earnings Contribution & Market Cap Weight | ||||
|---|---|---|---|---|
| Sector | Trailing 12-Months Earnings Contribution | Next 12-Months Earnings Contribution | Market-Cap Weight | Difference Between NTM Contribution & Market-Cap Weight |
| FIN | 20.5% | 17.6% | 12.9% | 4.6% |
| ENE | 9.3% | 7.4% | 4.0% | 3.5% |
| HC | 11.9% | 14.1% | 12.7% | 1.4% |
| COMM | 3.4% | 3.4% | 2.9% | 0.6% |
| UTL | 2.5% | 2.9% | 2.4% | 0.5% |
| CD | 6.4% | 5.9% | 5.7% | 0.3% |
| IND | 9.2% | 8.6% | 8.4% | 0.2% |
| CS | 6.7% | 6.4% | 6.2% | 0.2% |
| MAT | 2.9% | 2.5% | 2.4% | 0.1% |
| RE | 1.4% | 1.3% | 2.5% | -1.2% |
| TECH | 6.7% | 9.4% | 11.4% | -2.1% |
| MAG 7 | 19.0% | 20.5% | 28.7% | -8.2% |
Source: Strategas Research Partners 12/11/23
As with Bitcoin in 2021, we do not pretend to understand all the dynamics of AI and how it will practically relate to American businesses in the years ahead. Having said this, our suspicion is that AI could be overhyped regarding its actual impact on productivity and profits for the next few quarters, but at the same time, massively underestimated when looking ahead to the end of this decade.
5. Market Technicals are Bullish
It is probably not an exaggeration to say that the “bulls” have been given nearly “everything” they could hope for given the way financial assets behaved in the final two months of 2023. These dynamics won’t last forever, but the US economy has been far more resilient than many economists imagined; inflation has come down meaningfully from a year ago; the Fed has completed its rate hiking cycle; the labor market remains on extremely solid footing; and most importantly, the message from the stock market is a very clear “risk on.”
Most broad global equity markets are now above their 200-day moving averages, many of which are upward sloping. Betting against strong market trends prior to much evidence of these trends changing rarely works out well for contrarian investors. In addition, market internals look exactly like they should during a bull market, with traditionally defensive sectors among the biggest laggards and numerous high beta areas leading the markets higher.
Most importantly, numerous “buy signals” have triggered over the last several months. Often, similar “buy signals” are produced within weeks / months following notable bear market bottoms, but this was not the case following the October 2022 bear market lows. The fact that these signals are now being generated is somewhat of a “game changer” for many investors, helping to contribute to the increasingly bullish tone in markets. Nearly everyone would acknowledge that equity markets have gone a long way in a very short amount of time recently. But these signals are almost never generated at the end of a bull market, and when looking forward 6-12 months, the various buy signals listed below should very clearly be interpreted as bullish.
| Signal | Date Triggered | Average 1 Year Forward Returns | % Positive Returns 1 Year Forward | Source |
|---|---|---|---|---|
| S&P 500 makes a new all-time high after more than 1 Year without one | Not Yet Triggered but very close | 14.90% | 92.9%: 13/14 Since 1950 | Ryan Detrick & Carson Investment Research |
| > 60% of S&P 500 hits a 20-day high | 12/14/2023 | 17.70% | 95.8%: 23/24 Since 1990 | Chris Verrone, Todd Sohn & Strategas Research Partners |
| CPI drops 5% from its peak | 6/30/2023 | 14.94% | 83.3%: 5/6 Since 1943 | Bespoke Invest |
| S&P 500 up 20% After a > -20% Bear Market | 6/9/2023 | 18.90% | 91.7%: 11/12 Since 1949 | Seth Golden |
| Zweig Breadth Thrust | 11/3/2023 | 23.30% | 100%: 16/16 Since 1945 | Ryan Detrick & Carson Investment Research: NDR Research |
6. The Bond Market Remains in the Driver’s Seat
As we have noted, numerous positive factors helped contribute to the strong price action that markets exhibited to finish 2023. A perceived soft landing in the economy, solid expected earnings growth in 2024 / 2025, and broad participation with various “cheap” areas of the market catching up to mega cap technology stocks are all noteworthy. But the recent plunge in interest rates is the single most important catalyst for the rally in risk assets in our view.
The steady march higher in interest rates during the fall was certainly the main culprit behind the corresponding correction in global stock markets. It is hard to believe that only two months ago most media outlets were talking endlessly about further interest rate hikes from the Federal Reserve and the havoc “6% yields” would cause for most asset classes.
While the Fed has certainly pivoted by effectively acknowledging this rate hiking cycle is complete, how intermediate- and longer-term yields will behave in 2024 remains a complex calculation. Treasury issuance is going to increase meaningfully this year to fund our exploding debts and deficits. This concern was endlessly highlighted by many analysts last October, only to seemingly vanish overnight during the last couple of months.
The Fed is forecasting three 25 basis point rate cuts in 2024 in their own Summary of Economic Projections. In contrast, the bond market has priced in 150 basis points of rate cuts for 2024. In some regards, equity markets seem even more optimistic in the sense that they too believe in the 6 rate cuts but are counting on them in unison with 10% +/- earnings growth.
The goldilocks scenario of (meaningfully) lower interest rates across the yield curve with economic growth remaining solid and inflation continuing to fall could be a high hurdle for markets to deal with during the first half of 2024. We doubt the path for intermediate interest rates is straight down from here, given how far ahead of the Fed the bond market seems to be. Risk will be repriced if interest rates reverse higher again, thus leaving a seemingly narrower path to “goldilocks” than the markets may currently be considering.
7. Too Early to say “All Clear” on the Economy
There has been no shortage of reminders to anyone who is willing to listen, that “monetary policy acts with long and variable lags.” The economy is not yet past the historical range of time horizons between initial Fed rate hikes and the beginning of a recession. Several traditional recession indicators continue to flash red, namely inverted yield curves, negative year over year growth in US Leading Economic Indicators, negative year over year growth in the money supply, contracting bank lending, and signs of the consumer becoming increasingly stretched. According to Joe Zidle, the CIO at Blackstone, the US has experienced a recession in 14 of the last 16 Fed hiking cycles with 1963 and 1994 being the two exceptions.
Bearish investors are fond of mentioning that “this time will be different” if the economy avoids a recession. But regardless of the economic outcome in 2024, we need to remember that this time is “different” on countless fronts. Five reasons why this cycle has been unique include:
- Although we believe there are structural elements to inflation that will continue to persist in the years ahead, most of the elevated inflation readings of the last couple of years were due to distinct dynamics which resulted from the “COVID economy.” Specifically, supply chains were broken when the global economy shut down in 2020, and it took years to normalize these bottlenecks. In addition, policy makers exploded the money supply by unleashing fiscal and monetary stimulus in quantities beyond anything the global economy has ever experienced. Inflation and economic growth are often tied at the hip, and this inflation cycle seems to be nearly complete. But the end of an inflation cycle doesn’t necessarily mean the end of a business cycle, and maybe most of us are too heavily extrapolating the former to the latter?
- The labor market remains very tight as we continue to have a shortage of workers to fill all the necessary jobs that the economy requires. Dr. Ed Yardeni recently noted that “during October, there were 8.7 million job openings versus 6.5 million unemployed.” The Fed’s ideal scenario during this inflation battle has always been to rebalance the labor market by destroying job openings, without the unemployment rate moving meaningfully higher. As of now, the Fed seems to be pulling off this “impossible” task with near perfection.
- The global economy just experienced over a decade of interest rates near 0%, in turn making the economy less interest rate sensitive to changes in monetary policy. Most outstanding mortgages in the U.S. are below 4%, and corporations did a terrific job of terming out their debt. Dr. Yardeni has pointed out that we should be viewing this rate hiking cycle through the lens of “normalizing” interest rates from unnaturally low levels rather than “500 basis points of rate hikes.” Interest rates being back to “normal” is a good thing!
- David Zervos from Jefferies has spoken extensively about the stock vs. flow of QE / QT. Yes, the Fed is conducting QT and has shrunk their balance sheet by over $1T from peak levels. At the same time, the Fed balance sheet remains massively larger than it was pre-COVID, thus acting as a cushion for the economy as elevated levels of liquidity remain in the financial system.
Could we have already had a recession and not realized it? Although it was fractional, real GDP shrank in Q2 2022 vs. Q1 2022. In addition, several pockets of the economy have fallen into recession at various times over the last few years. China and Europe are likely in a recession currently, but this won’t last forever. BofA Global Research has a proprietary economic Regime Indicator that flipped from “Downturn” to “Recovery” in August of last year. If we had to guess, even their own economists might have been flabbergasted by the output of this model in real time.
8. The S&P 500 is NOT the Economy
It is undeniable that corporate earnings growth and economic growth are correlated over time. In other words, companies cannot sustainably grow earnings if the economy is not growing. Having said this, primary drivers of growth are not the same for the economy vs. corporate earnings. The predominant engine of the US economy is the consumer, while the stock market is more sensitive to goods / manufacturing.
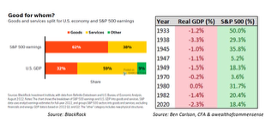
Source: BlackRock Source: Ben Carlson, CFA & awealthofcommonsense
Most of corporate America experienced an earnings recession in 2022 & 2023. S&P 500 earnings have been flat for over two years and were down on a year over year basis in Q2 & Q3 of 2023. The earnings contraction for “main street America” (i.e., small & mid cap stocks) was even more severe, but corporate earnings look to be reaccelerating across the board in the quarters ahead.
Regardless of the recession outcome, one thing for certain is that this has been the most forecasted recession in modern history. CEO’s & CFO’s did everything they reasonably could to prepare for a recession – shoring up balance sheets, resetting expenses, and restraining themselves on less certain future investments. Could a new CAPEX cycle mean the worst of the earnings recession is behind us even if economic growth grinds to a halt for a couple of quarters in 2024?
9. Liquidity
Dan Clifton of Strategas Research Partners published extensive work last year about the stealth liquidity which was deployed into the economy. This is counterintuitive on many levels given the fact that the Fed continues to shrink their balance sheet through their quantitative tightening program. Nonetheless, the Fed’s Reverse Repurchase facility coupled with the government’s spending down of the Treasury General Account supplied ample liquidity to the economy in 2023. And this does not even speak to the fact that the government ran all time high budget deficits as a percentage of GDP, outside of wartime / recession.
Dan and his team have a package of extensive charts which plot their proprietary “Strategas Net Liquidity Indicator” against the price of various assets including the S&P 500, Bitcoin, bond yields, the US dollar, etc. One doesn’t have too look very hard at the chart below to observe that liquidity was a meaningful tailwind for the S&P 500 in 2023, after having had the exact opposite effect in 2022.
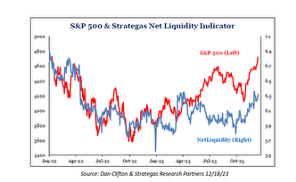
Source: Dan Clifton & Strategas Research Partners 12/18/23
The stealth liquidity injections from 2023 serve as a good reminder that policy makers have plentiful (lesser known) policy tools capable of boosting the economy over shorter time frames. In his year ahead outlook, Jason Trennert from Strategas Research Partners wrote “To the extent to which 2024 will be a year in which national elections will take place in countries that represent more than 40% of the world’s population and 80% of its stock market capitalization, we believe it is important to remember that incumbents will be even more incentivized to keep their economies out of a recession at all costs. In that regard, our forecasts for the markets must and will include very careful consideration of more than just overall liquidity in the system, but also efforts to aggressively manipulate previously arcane tools like the Treasury’s refunding schedule and its General Account, the overnight Reverse Repo market, and the Fed’s Bank Term Funding Program.“
The list of variables with the potential to influence asset prices only seems to expand as our capital markets continue to evolve in their complexity. The government’s ability and willingness to influence asset prices over shorter time horizons also continues to increase. Tom Tzitzouris from Strategas Research Partners wrote “With utilization of the TGA, we’ve entered the era of “Treasury directed QE.” It’s a threat to the Fed’s independence, the taxpayer, financial market stability, and price stability, to allow the Treasury to smooth over seasonal liquidity for political gain. Structurally, this should lead to higher inflation, higher rates, and more contested fiscal debates in the future, all of which should challenge financial market valuations.“
10. 2024 US Equity Market Forecast
As we have insinuated throughout this writing, making short term equity market forecasts is an extremely difficult task. Having said this, we do want to highlight this instance when various schools of research seem to be converging on a similar conclusion (we do not believe this is a “consenses” viewpoint either). As we wrote about in bullet point #5, equity markets are short term overbought on most metrics and are likely in need of a breather before any further meaningful advance is likely to occur. At the same time, uptrends are well solidified for the time being, and numerous “buy signals” suggest higher than average probabilities for positive returns this calendar year.
Tom Lee is usually one of the biggest “bulls” on Wall Street, and he has one of the highest S&P 500 price targets among strategists for this year, as is often the case. However, he believes that most of this year’s gains will be back-end loaded as markets will need to spend some time chopping around near the previous all times highs while investors wait for more clarity from the Fed regarding the timing of rate cuts this year.
Michael Hartnett from BofA Global Research has generally had a more cautious tone on risk assets for most of the last couple of years. But he also believes that a broad based rally in risk assets could occur during the back half of 2024. The difference is that Hartnett believes we will have a legitimate growth scare (if not a recession) first, therefore meaning this eventual rally would generally occur from lower price levels. In his 2024 The Year Ahead report Hartnett wrote: “3Cs = 3Ps = 3Bs: we don’t think Wall Street bear ends until Credit, Crude & Consumer threaten hard landing / credit events, triggering bearish Positioning, recessionary Profits & Policy panic, which in turn triggers ’24 bull markets in Bonds, Bullion & Breadth.“
Stephen Suttmeier, who heads the technical strategy team at BofA Research, is yet another strategist who generally supports this viewpoint. In his first research note of 2024 he wrote “Given the big bases across many US equity indices and plenty of confirmation from other key indicators in late 2023, we believe that a tactical hangover in early 2024 should precede a solid 2024.” In a separate research piece, Suttmeier also noted that a failed Santa Claus rally and a negative first five trading days of the year are meaningful indicators which suggest a weaker year ahead, especially during the first half. One of his charts cited that, when the first five days of January are positive, the average S&P 500 return for the year is 11.22% with 75% of years being positive. The average February – December return (after a positive first five trading days) is 8.72% with 78.13% positive returns for the period. This is in stark contrast to when the first five trading days of January are negative, as they were in 2024. When this occurs, only 50% of years are positive with an average return of 1.11%. For the February – December period, 56.25% of periods are positive with an average return of 2.09%. This data encompasses all calendar years from 1928 – 2023 (source: Stephen Suttmeier: BofA Global Research: Santa Delivers a Lump of Coal 1/4/24).
Finally, seasonality in presidential election years also corroborates the thesis of a relatively more difficult first half of the year followed by stock market gains in the back half of the year.
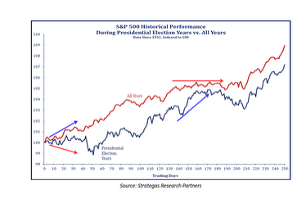
Source: Strategas Research Partners
In conclusion, we enter 2024 with extreme humility as we find ourselves having more questions than answers for what may lie ahead in the year to come. Recession or soft landing? How much of the upside economic growth surprise in 2023 was due to fiscal stimulus? Will Geopolitical events disrupt markets in 2024? What impact will center city office commercial real estate have on the economy / banking system? Can the Fed really cut rates six times if economic growth remains solid? Will we experience a second wave of inflation as financial conditions have eased? Will QT eventually have a negative effect on asset prices since QE was so generous to asset prices? Did the Q4 2023 rally pull forward much of 2024’s stock market gains similar to 2017 / 2018? Or was October 2023 the beginning of a new multiyear bull market (even though stocks bottomed in October 2022)? Can a new bull market begin with historically high valuations (for the S&P 500) and low unemployment? Has the new “fair value” multiple for the S&P 500 permanently rerated higher (18x – 19x instead of 15x – 16x NTM EPS) given the fact that many technology stocks seem to warrant above average market multiples? Will market performance mean revert across asset classes or is this like the late 1990’s when tech stocks led year in and year out? How much of the $6T in money market funds will find its way into risk assets? How will AI affect our lives in the years to come?!
All of these questions fascinate us, even if some of them make us worry a bit. At the same time, we find ourselves optimistic about the prospects for well diversified portfolios over intermediate to long term time horizons, which is a distinct improvement from the end of 2021 when nearly everything was expensive and bond yields were near 0%. As humans we are wired to think about what could go “wrong” much more than what could go “right.” The realistic probability of a fourth industrial revolution / technology led productivity boom only seems to be gaining traction by the day.
2024 will undoubtedly present investors with plenty of surprises. We continue to believe that our portfolios are well positioned to withstand the inevitable bumps along the way while also capturing the positive outcomes which will reward investors in the years ahead.
It is our honor and privilege to work with you and your families. We look forward to seeing you in person in 2024.
Sincerely,
Brian Gift, CFA
Chief Investment Officer
MBL Advisors
Bob Farrell’s 10 Investing Rules
Bob Farrell is a legendary Merrill Lynch strategist who published his timeless list of 10 investing rules several decades ago, a version of which can be found here: https://www.investopedia.com/articles/fundamental-analysis/09/market-investor-axioms.asp.
We have written about Bob Farrell’s rules on multiple occasions in the past. Nonetheless, the simple brilliance of these rules always amazes us each time we observe them.
- Rule #1. Markets tend to return to the mean over time.
- Rule #2. Excesses in one direction will lead to opposite excesses in the other direction.
- Rule #3. There are not new eras – excesses are never permanent.
- Rule #4. Exponential rapidly rising or falling markets usually go further than you think, but they do not correct by going sideways.
- Rule #5. The public buys the most at the top and the least at the bottom.
- Rule #6. Fear and greed are stronger than long-term resolve.
- Rule #7. Markets are strongest when they are broad and weakest when they narrow to a handful of blue-chip names.
- Rule #8. Bear markets have three stages – sharp down, reflexive rebound and a drawn out fundamental downtrend.
- Rule #9. When all of the experts and forecasts agree – something else is going to happen.
- Rule #10. Bull markets are more fun than bear markets.
Disclosures:
This content was prepared by MBL Advisors and reflects the current opinion of the firm, which may change without further notice. This report is for informational purposes only and is not intended to replace the advice of a qualified professional. Nothing contained herein should be considered as investment advice or a recommendation or solicitation for the purchase or sale of any security or other investment. Opinions contained herein should not be interpreted as a forecast of future events or a guarantee of future results. Different types of investments involve varying degrees of risk, and there can be no assurance that any specific investment will either be suitable or profitable for a client’s portfolio. Economic factors, market conditions, and investment strategies will affect the performance of any portfolio and there are no assurances that it will match or outperform any particular benchmark. Commentary regarding the returns for investment indices and categories do not reflect the performance of MBL Advisors or its clients. Historical performance results for investment indices and/or categories generally do not reflect the deduction of transaction and/or custodial charges or the deduction of an investment-management fee, the incurrence of which would have the effect of decreasing historical performance results. Investors cannot invest directly in an index.
The indices referenced herein have been selected because they are well known, easily recognized by investors, and reflect those indices that the firm believes, in part based on industry practice, provide a suitable benchmark against which to evaluate the investment or broader market described herein. Although certain information has been obtained from sources believed to be reliable, we do not guarantee its accuracy, completeness, or fairness. We have relied upon and assumed without independent verification, the accuracy and completeness of all information available from public sources.
This material is provided for informational purposes only. It is not an offer or solicitation to buy or sell any securities. Past performance does not guarantee future results, which may vary. The value of investments and the income derived from investments will fluctuate and can go down as well as up. A loss of principal may occur.
MBL Advisors Inc. is independently owned and operated. Investment Advisory Services are offered through MBL Wealth, LLC, a Registered Investment Advisor. Securities are offered through M Holdings Securities, Inc., a registered broker/dealer, member FINRA/SIPC.
File # 5079645
This material and the opinions voiced are for general information only and are not intended to provide specific advice or recommendations for any individual or entity. To determine what is appropriate for you, please contact your personal advisors. Information obtained from third-party sources are believed to be reliable but not guaranteed. The tax and legal references attached herein are designed to provide accurate and authoritative information with regard to the subject matter covered and are provided with the understanding that MBL Advisors Inc., is not engaged in rendering tax, legal, or actuarial services. If tax, legal, or actuarial advice is required, you should consult your accountant, attorney, or actuary. MBL Advisors Inc., does not replace those advisors. The use of trusts involves a complex web of tax rules and regulations. You should consider the counsel of an experienced estate planning professional before implementing such strategies.
MBL Advisors Inc. is independently owned and operated. Investment Advisory Services are offered through MBL Wealth, LLC, a Registered Investment Advisor. For important information related to MBL Wealth, LLC, refer to the Client Relationship Summary (Form CRS) by navigating to http://mbl-advisors.com. Securities are offered through M Holdings Securities, Inc., a registered broker/dealer, member FINRA/SIPC. For important information related to M Holdings Securities, Inc, refer to the Client Relationship Summary (Form CRS) by navigating to https://mfin.com/m-securities. Insurance solutions are offered through MBL Advisors Inc.