Category: Advanced Market Insights
Date: April 14, 2025
Brian Gift, CFA — Chief Investment Officer — 704-335-4518
A RETURN TO NORMAL
Capital markets seem to have become increasingly dynamic as the pace of innovation has compounded around the world, which in turn has given investors an endless list of variables to consider when constructing portfolios.
In this Investment Strategy Outlook, we will elaborate on various topics including investor sentiment, elevated valuations, diversification versus concentration within portfolios, inflation, interest rates, Trump, and AI.
In the end, we believe many of these factors will lead to the continuation of higher levels of nominal growth, interest rates and an ensuing extension of the profit cycle for corporate America. There will surely be plenty of surprises unanticipated by the countless 2025 “Year Ahead” outlooks written over the last couple of months. However, it seems that policy makers will be an obvious source of volatility (in both directions) for all asset classes in the year ahead.
Risk assets have demonstrated unease with 10-year bond yields above 4.5% +/- on numerous occasions over the last couple of years. A couple of large Wall Street Investment houses are putting 40% odds on the Fed having to reverse course and hike rates in 2025 (we disagree, but who knows for sure). America is far more sensitive to higher prices than we were prior to COVID, which in turn means that the bond market will demand that the Fed continues to thread the proverbial needle in balancing their dual mandate. Similarly, Trump was anything but a fiscal hawk during his first term as President, and 6% +/- budget deficits will likely not be tolerated by the markets indefinitely.
The bottom line is that the bond market will continue to have a significant influence on how most asset classes behave. Like many investors, we are rooting for a broadening of both fundamentals and performance beyond Mega Cap tech (“US exceptionalism”). We are optimistic that conditions are in place to support this narrative in the years ahead.
1. Wall Street is Bullish
Investors are far more enthusiastic entering 2025 than they were to start 2023 or 2024, which seems to be well justified in many regards as economic data continue to track at a respectable level (Atlanta Fed GDPNow tracking at 2.3% for Q4 2024), the unemployment rate continues to hold steady near multi decade lows, credit spreads remain pinned to their cycle lows, and most importantly, earnings growth is forecasted to be robust for the foreseeable future.
The majority of Wall Street strategists have set their S&P 500 price targets to forecast gains in the 10% – 15% range for 2025. This is a notable shift from 2023, when the average strategist price target projected a negative year (the only time this has happened since 1999. Source: Bloomberg). At the beginning of 2024, the outlook among strategists wasn’t much more bullish, as the average price target was only 2% – 3% above where the year began.
The Bank of America Global Fund Manager Survey is often a good indicator of how the consensus is positioned. In December 2024, the Fund Manager Survey showed a record overweight to US equities in the history of this survey going back to 1999. This is in comparison to March 2023 (SVB Bank failure), when investors were holding their largest underweight to US equities since prior to 2008.
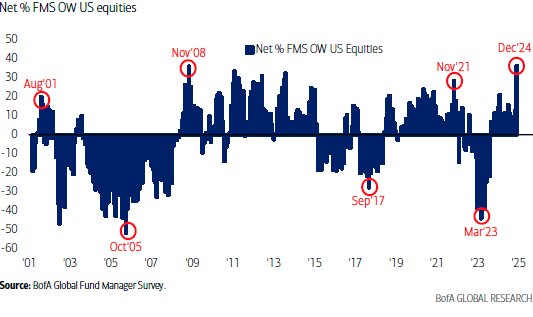
Source: BofA Global Research
The December Fund Manager Survey also revealed a similar dynamic with broad equity positioning relative to cash. Today, equity positioning is near its previous peaks relative to cash. It’s worth noting that the inverse was true in September 2022, precisely when the previous bear market ended, and investors held an all-time underweight to stocks vs. cash.
Myriad additional data points corroborate this same message. A few others of note are:
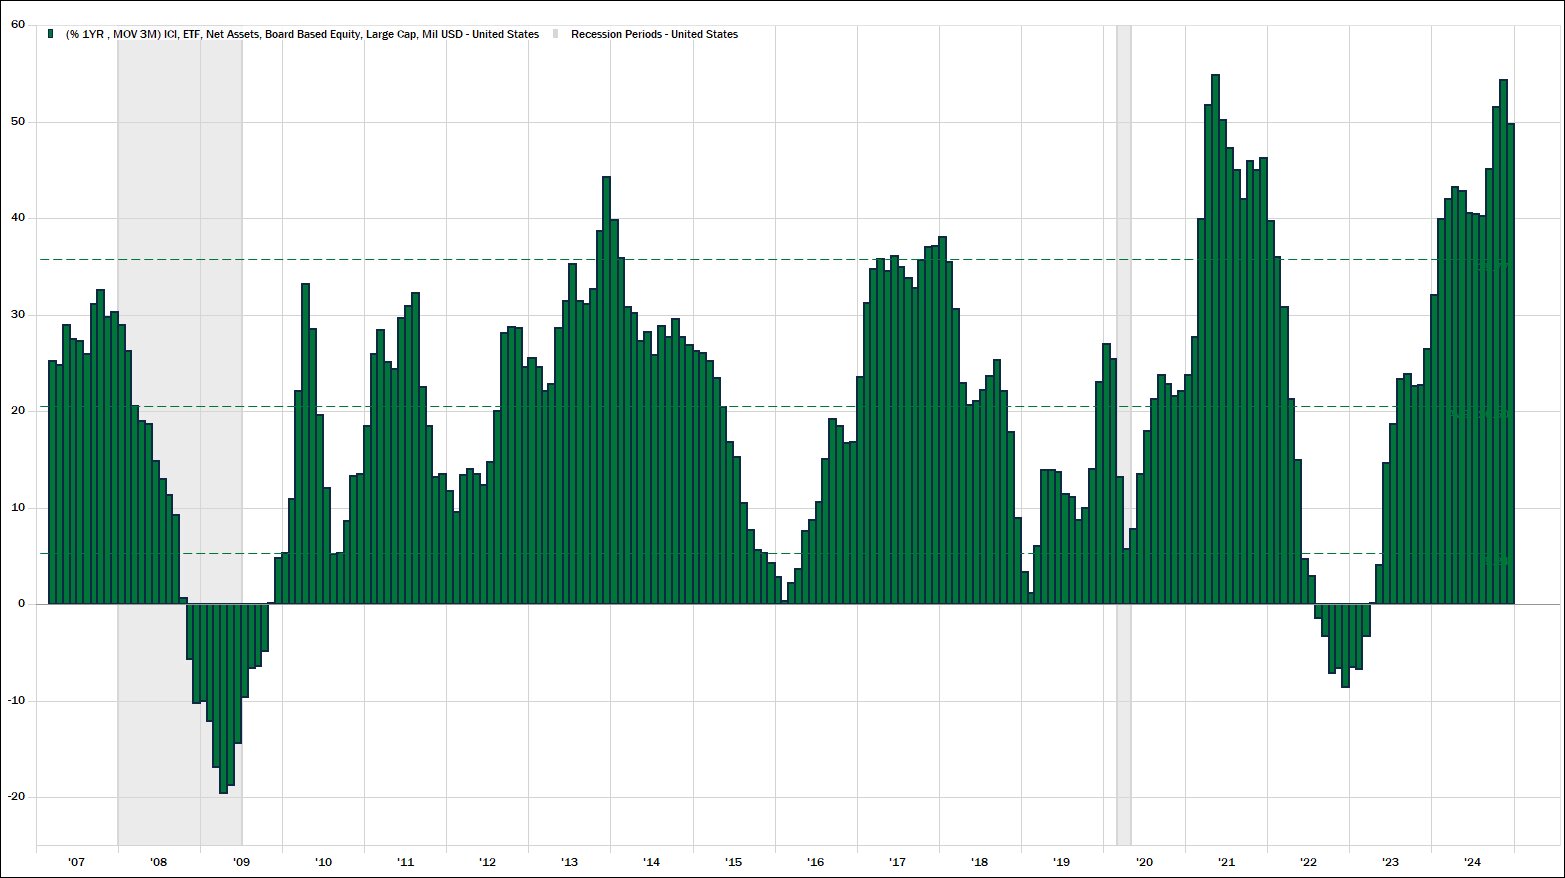
- Dollar flows into US Large Cap ETFs are in line with the historic pace set in 2021.
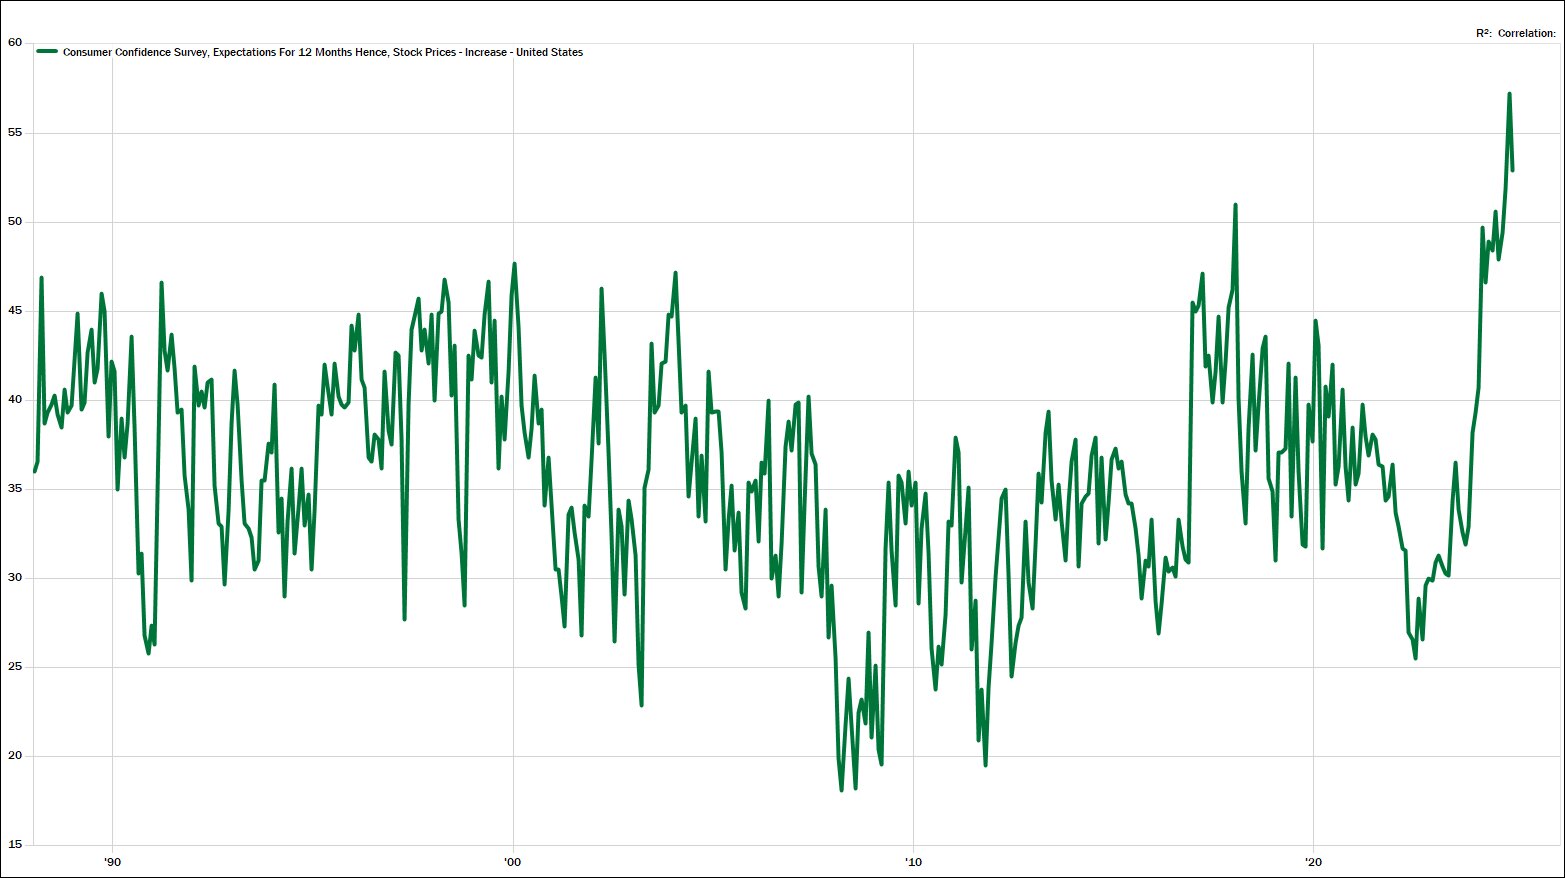
- According to the conference board, investors have never been more optimistic about their expectations for higher stocks prices in the year ahead.
- Levered long ETF’s have 11x more assets than short ETF’s (source: Strategas Research Partners). And they are trading in excess of $80B of volume per week (source: Bloomberg).
- Although it is not back to the worrisome levels of 2021, FINRA margin debt has been moving aggressively higher.
- The Ratio of sellers to buyers among corporate insiders is nearly 6 to 1, which is an all-time high (source: Financial Times). Thus, corporate insiders are acting in an opposite manner to most other investors.
Source: MBL Advisors & FactSet
Source: MBL Advisors & FactSet
Much of this is the natural course of evolution during a bull market. In isolation, none of these data points tend to signal the end of a bull market. But they could offer a clue suggesting that investors may need to wrestle with their own (lofty) expectations at some point in the year to come.
2. Bearish Risks
Economic weakness and an ensuing recession are no longer perceived as the primary danger to asset prices by most investors, contrary to a large swath of the past three years. Goldman Sachs recently noted: “80% of our clients expect US GDP to grow above 2% this year and no one anticipates a recession, with only 1% of clients expecting US GDP growth below 1%. This is in stark contrast to 2024 and 2023, when 27% and 57% of people, respectively, expected a recession” (source: @zerohedge).
Even David Rosenberg, the famed market bear, and incredibly astute research analyst, issued an apology to investors last December in his note titled “Lament of a Bear” (source: @EconguyRosie). This followed some of his less than optimistic counterparts losing their jobs earlier in the year (Chief Strategists at JP Morgan & Morgan Stanley).
Despite the bears on Wall Street becoming an increasingly rare breed, the media is eager to remind us of the plethora of potential worries: tariffs, inflation, weak growth outside of the US, higher interest rates, a strong USD, fiscal excesses, a Fed policy error, other things that go bump in the night. But investors are often well served in remembering that bull markets usually climb the proverbial “wall of worry.” Markets often get into trouble when signs of discomfort have largely disappeared (2018, 2021, etc.).
When putting macro / headline risks to the side for a moment, we do believe that there are two hazards which are potentially underappreciated by investors today. First, nearly all fundamental valuation metrics are registering in the 90th to 99th percentile of historical data (2009 was the exact opposite). And second, index concentration has reached multi-decade highs for the S&P 500. This is not to say that there is a shortage of attention on either of these issues, but some investors seem to expect these trends to continue almost indefinitely.
Last October, Goldman Sachs, Apollo and Bank of America Global Research simultaneously noted that they expect the S&P 500 to compound at roughly 3% per year for the next several years (+/- a few % on either side). More recently, Morningstar has joined this crowd. Apollo is relatively more bullish compared to the others, as their 3% return forecast “only” lasts for three years. Bank of America Global Research and Goldman Sachs projected 3%+/- returns for the next decade, given where starting valuations are today.
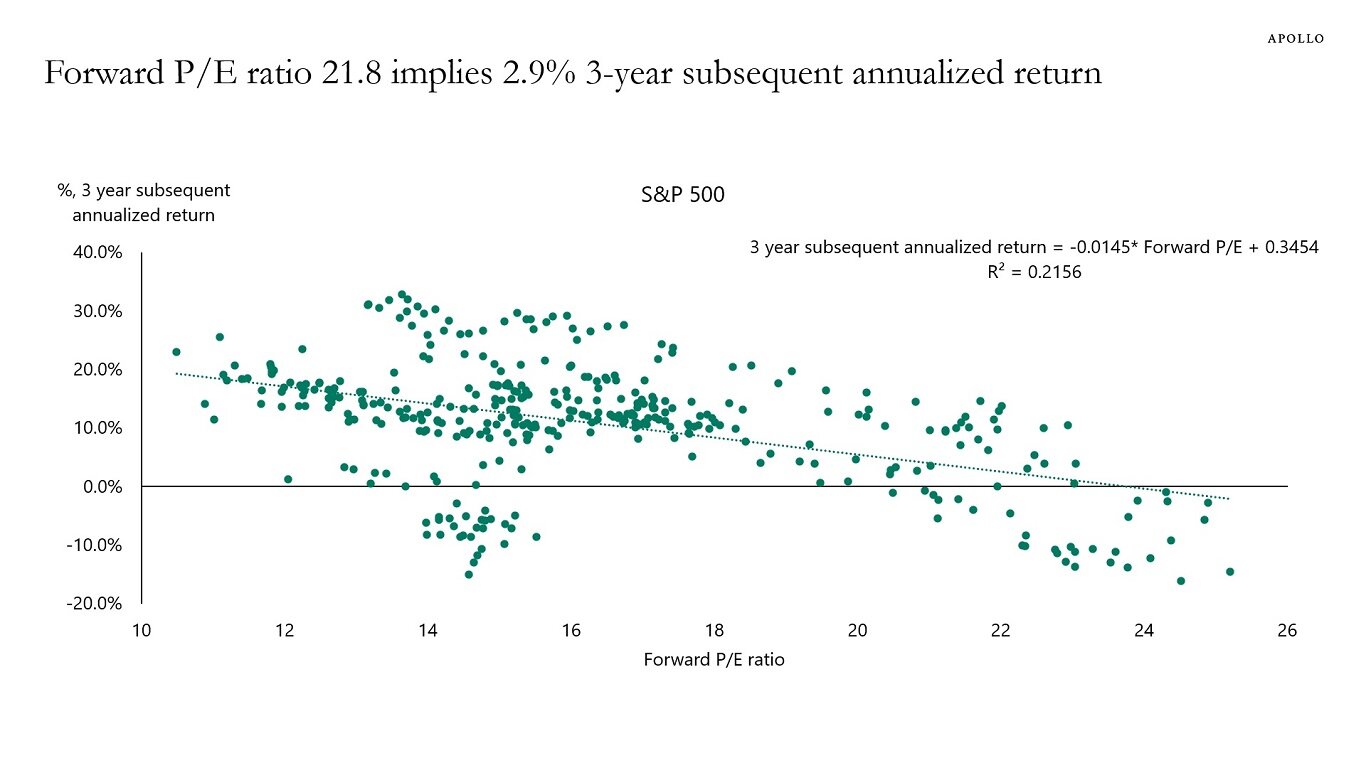
Source: Apollo & Torsten Slok
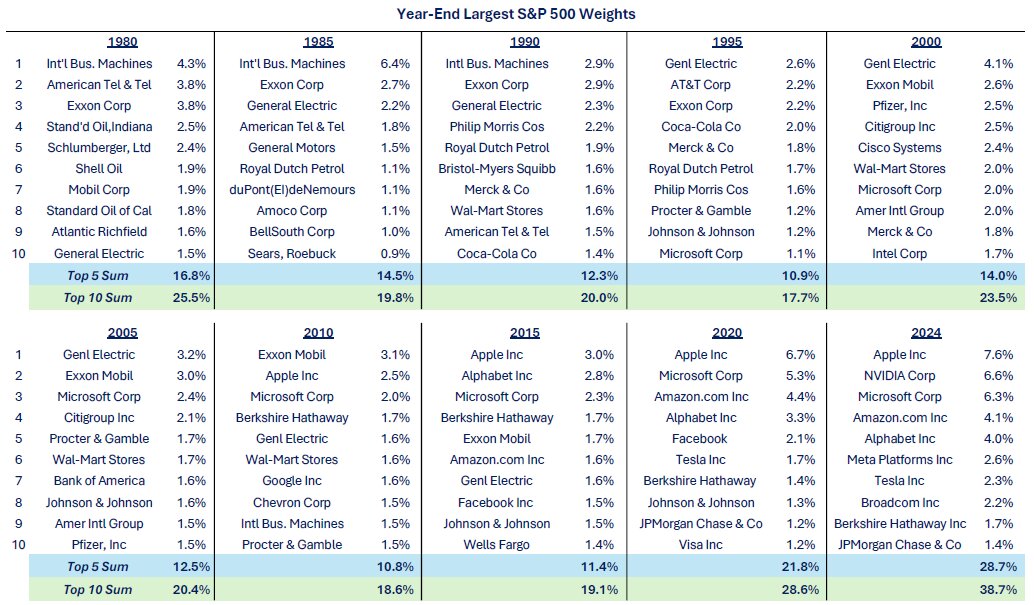
The historically elevated valuations in US Large Cap equity indices are directly tied to the increased concentration within these indices themselves. The largest 10 stocks are some of the most expensive stocks in the market from a fundamental standpoint and now make up 39% of the S&P 500. The top five names account for 29% of the index. We haven’t seen these levels of concentration within the S&P 500 in nearly 70 years. For most of the last 40 years the top 10 stocks constituted roughly 20% +/- of the index, while the top five names made up 11% – 15% of the S&P 500. Thus, the concentration of the top five and top 10 names in the index has effectively doubled relative to most of the last 50 plus years.
This has served investors well for the last decade as the largest names have also been the best performing names during this time. This has made the S&P 500 virtually an unbeatable index for investors who have higher levels of diversification within their portfolios.
The cap weighted S&P 500 roughly doubled the performance of the equal weighted S&P 500 in 2023 and again in 2024. The reason for this can be simply explained in the fact that the largest 10 names accounted for 68% of the index’s total performance in each of the last two years (source: Strategas Research Partners). Carter Braxton Worth of Worth Charting noted that “2024 was a not so spectacular year for US equities. The Russell 3000 (98% of the investible US Equity Market) was +22%, yes, but the median performance of the Index’s constituents was 3.82%. 1331 stocks in the index were DOWN (45.7%). Sobering” (source: @CarterBWorth).
It is important to note that valuations are a terrible timing tool and offer no predictive power over shorter time frames. This is especially true when animal spirits are running hot as they seem to be today. However, the simple average trailing twelve-month PE ratio (i.e. based on 2024 EPS) for the 10 largest stocks in the S&P 500 currently stands at 46x (source: MBL Advisors & FactSet 1/30/25).
Source: Todd Sohn, CMT & Strategas Research Partners
Aside from the early 1970’s, the late 1990’s and the 2020’s, the equal weighted S&P 500 has outperformed the capitalization weighted S&P 500 throughout most intermediate to longer term time periods over the last several decades. One big question for investors is whether the dominance of the largest stocks in the market is the “new normal” or if dramatic mean reversion lies ahead? Eventually, we believe the beneficiaries of AI will expand well beyond the Mag 7, and this will serve as a catalyst for some mean reversion in market performance.
Savita Subramanian and Bank of America Global Research are firmly in the mean reversion camp as their 10-year forecast is far more bullish for the equal weighted S&P 500. Savita believes that the equal weighted S&P 500 could compound at roughly 8% +/- per year for the next decade if dividend payout ratios mean revert higher back to their long-term averages. Richard Bernstein of RBA Advisors was Savita’s mentor at Merrill Lynch a few decades ago, and he also shares a similar opinion.
We believe that the increasingly popular analogies to the tech bubble are a poor comparison to the current market environment. The best performing stocks of the last few years are some of the highest quality businesses in the history of corporate America, which is much different than the TMT bubble. However, the Nifty Fifty environment from the 1970’s may offer some parallels, when investors bid up the largest stocks in the market to unsustainable valuations and considered most other businesses not to be worthy of their capital.
3. Bullish Forecasts
Ed Yardeni (Yardeni Research) and Tom Lee (FSInsights) continue to be two of the most optimistic strategists on Wall Street. They also happen to be two of the most accurate strategists of whom we are aware, over the last 15 years. Yardeni believes the S&P 500 will finish this decade around 10,000 as earnings for the index will be roughly $400 per share. If 2025 and 2026 earnings stay on track with current estimates, Yardeni’s earnings forecast could become increasingly consensus as time passes.
Tom Lee (FSInsights) has published some even more bullish scenarios than Yardeni. Lee believes that meaningful bear markets often coincide with generations moving beyond peak spending years (28-48 years old). Millennials have another decade plus of peak spending ahead of them, which Tom believes is a positive catalyst for US equities, all else equal.
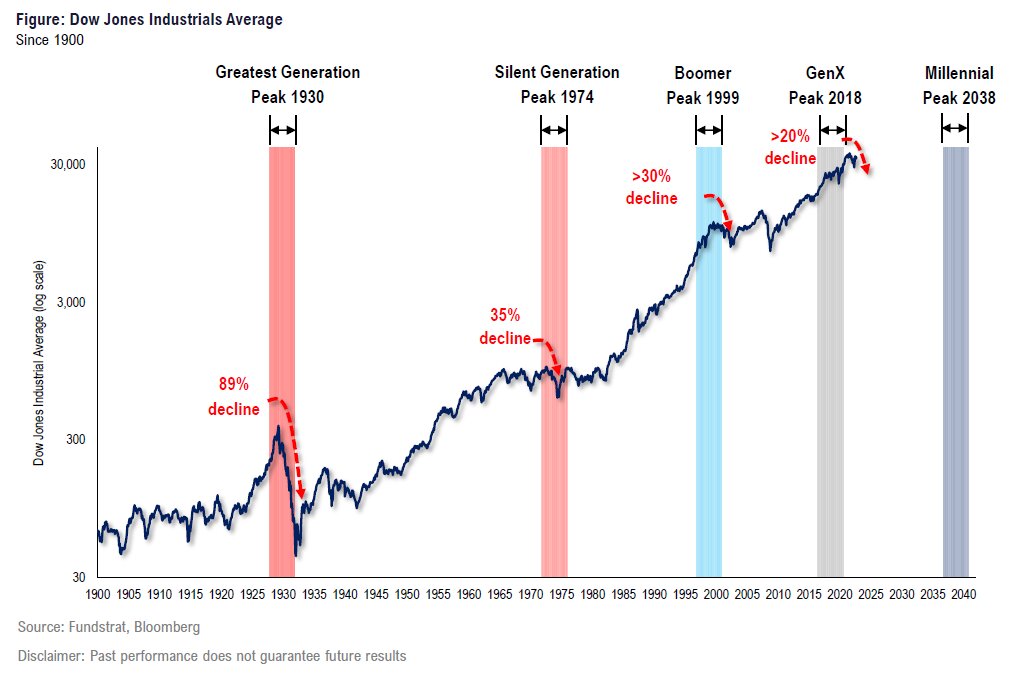
Source: FSInsights & Tom Lee
Both of these strategists believe we are in the middle of a technology driven productivity boom. And if this continues, historically high corporate operating margins will hold steady, and therefore support earnings in the years to come. In their opinion, more profitable businesses which also exhibit secular growth characteristics (Mega Cap Tech) are largely deserving of elevated valuations relative to historical “norms.”
In his 2025 technical outlook, Stephen Suttmeier from BofA Global Research published the following:
“In 2025 the SPX will enter the 12th year of its secular bull market. The secular bull markets from 1950 – 1966 and 1980 – 2000 lasted 16 and 20 years respectively, which means the current secular bull market is mid to late cycle and can extend until 2029 to 2033… The SPX looks overextended on its move to 6000 in late 2024. This roadmap chart shows SPX achieving 6000 in mid-2026, not late 2024 and suggests that 2025 could see downward mean reversion.”
Regardless of how 2025 plays out, it should be noted that comparison to these previous secular bull market roadmaps project meaningful upside for the S&P 500 before this secular bull market is finished.
4. Back to Normal
Brian Belski, the Chief Investment Strategist at BMO Capital Markets, believes we are returning to a “normal” environment for both the economy and capital markets alike. His definition of “normal” refers to the investment environment prior to 2008. The post GFC environment has been abnormal in many regards, as central banks and governments around the world have become fond of enacting various measures of fiscal and monetary policy which are unconventional and extreme by historical standards. Jason Trennert of Strategas Research Partners recently wrote “Reversion to the mean, at least until the introduction of extraordinary monetary policy, had been one of the most reliable concepts in finance, if not life itself.”
The most important asset price in the world, the US 10 Year Treasury Bond has certainly normalized to a large degree. 10-year bond yields approaching 5% seem high to many investors relative to fifteen years of artificially low rates. But going back to 1950, the average yield on the 10 Year Treasury is 5.62% and the median yield on the 10 Year Treasury bond is 4.96% (source: MBL Advisors & FactSet).
Despite conventional thinking, higher bond yields are not necessarily a bad thing, if they are associated with stronger economic growth. Real GDP was below 2% for the entire period between 2008 and COVID. For the last few years, the US economy has surprised to the upside with 2% – 3% Real GDP growth, thanks to higher levels of productivity (and government spending), coupled with 5% – 6%+ nominal GDP growth. These levels of growth were declared a thing of the past by many economists during the post-GFC era.
Higher levels of nominal GDP are favorable for corporate profitability since revenues grow in nominal terms. In this regard, Belski believes that companies can grow earnings, across a plethora of industries and market caps, by upper single digits rates in the years to come. He also believes that US equity markets should compound at a similar rate over the next three to five years.
Mega Cap Technology (related) companies have carried the earnings growth for the entire market for the last two years. These businesses are expected to grow earnings at a very healthy rate again in 2025, but earnings momentum is projected to slow relative to the last several quarters. Conversely, earnings momentum is expected to accelerate across most other parts of the market (sectors and sizes) in 2025. This will be a “show me” story since investors have been waiting for this narrative to come to fruition for several quarters now. Nonetheless, if corporate America (excluding Mag 7) can deliver on the expectations for solid earnings growth, this should be an incredibly welcomed and positive catalyst for investors in 2025.
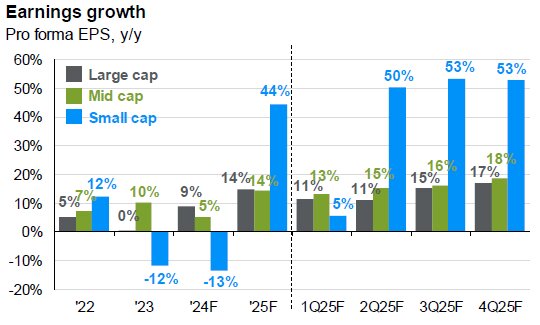
Source: JP Morgan Guide to the Markets
Further supporting the potential dynamic for a broadening out of leadership beyond the largest market capitalization names is the following analysis from John Roque, Chief Technical Strategist at 22V Research:
- The Russell 2000 experienced a bear market from November 2021 to October 2023 (the bear market for Large Cap stocks ended in October 2022).
- This was the second longest bear market for the Russell 2000 going back to 1980 – longer than the GFC version. A 23-month bear market for the Russell 2000 is 2x the average bear market (11.15 months) and 3x the median bear market (8 months).
- The most recent bear market had a -34% decline peak to trough, in line with the historical average of -36% and median of -34%.
- Bull markets for the Russell 2000 have produced average gains of 131% with 7 of 11 bull markets producing triple digit gains. The four non-triple digit bull markets produced gains of at least 75%.
- The shortest bull market lasted 10 months, the longest lasted 89 months. The average length is 34 months, and the median is 25 months.
- The current bull market achieved a 50% gain from its October 2023 lows to its most recent peak in November 2024. As of late January 2025, the Russell 2000 bull market is 15 months old and is up 42% from its October 2023 bear market lows. Statistically, this bull market in US Small cap stocks likely has further to run.
Dennis DeBusschere of 22V Research stated that “Small Caps have dramatically under-earned nominal growth. That is expected to revert in 2025. There is little reason to fade that outlook. This is a large part of the reason we favor small caps in 2025.”
To be clear, we favor US Mid Cap stocks over US Small Cap stocks. US Small Cap stocks have their issues, as roughly 40% of the Russell 2000 index is non-profitable and these businesses are usually more sensitive to higher interest rates. At the same time, smaller businesses could be the disproportionate beneficiaries from deregulation, and the NFIB Small Business Optimism Index has surged since the election.
5. The Forgotten Asset Classes
In the January 2025 BofA Global Fund Manager Survey, Michael Hartnett’s “Bottom Line” was that “investors are bullish the US$ & (US) equities, bearish everything else.” Chris Verrone of Strategas Research Partners often notes that the golden rule of this business is that “sentiment follows price.” Bonds, cash, and equities outside of the United States have not given investors many reasons to be bullish over the last few years.
MBL Advisors remains meaningfully underweight non-US equities relative to our strategic targets, as we have for nearly the entirety of the last seven years. Taking a contrarian stance simply for the sake of being contrarian is rarely a good strategy in isolation. Having said this, some interesting setups may be taking shape in equity asset classes other than US equities.
European equities are trading at their largest discount ever to US equities on a forward PE basis (Source: Strategas Research Partners). Part of this dynamic is due to the premium valuations which US technology stocks are awarded by investors, and the lack of similar businesses which exist within the European indices. However, this historically high valuation premium persists when neutralizing the sector exposure between the two indices. It is also important to mention that the Euro Stoxx 600 is at all-time highs, in local currency terms. Thus, this valuation gap does not exist solely due to poor absolute performance from European equities.
President Trump recently mentioned he believed that 600,000 – 700,000 Ukrainian soldiers had been killed in the Russia – Ukraine war. He also said that Russia had lost 800,000 soldiers. These figures are 10x – 15x higher than what is being reported by Russia and Ukraine themselves. Surely Trump can exaggerate at times, but these statistics are likely more directionally accurate than the drastically lower figures Russian and Ukraine are citing. Regardless, Trump is beginning to speak about using sanctions as a tool to incentivize an end to the fighting. All else equal, European equities might demand less geopolitical risk premium if some sort of resolution is reached between Russia and Ukraine in the months ahead. The December 2024 BofA Global Fund Manager Survey noted that investors have a near record overweight to US equities relative to Eurozone equities, going back to 2001.
Chinese equities are the ultimate wild card as we enter 2025. China’s economy is nothing short of a disaster, as they are in the middle of a deflationary debt spiral, best observed through the tanking of their bond yields and their slowly weakening currency. Their one child policy of the last few decades has created a demographic time bomb, and the trick seems to be up on the centrally planned investment spending which helped catalyze their economic boom years of the past. Currently, Beijing is striving to stimulate the consumer through various measures as their economy continues to slow, and they wait to find out the extent to which increased tariffs will impact their economy. The size and scope of their stimulus response will likely be directly tied to the enviable tariff policies coming from the new administration.
We don’t pretend to have any edge in investing in China, and less than 1% of our portfolios have exposure to their equity markets. Having said this, the two best technical analysts of whom we are aware of, Jeff deGraff of Renaissance Macro and Chris Verrone of Strategas Research Partners, are both bullish on Chinese equities as we enter 2025 (shockingly, Chinese equities outperformed US equities in 2024). They believe we encountered some very rare and bullish signals in the Chinese equity markets last fall when their stimulus program was originally announced and Chinese equity markets rocketed higher for a few weeks. Cyclical sectors have continued to exhibit strong relative performance versus defensive sectors since then, while fund flows and sentiment have once again turned (contrarian) bearish (source: Jeff deGraff & Renaissance Macro).
When extending our time horizon beyond the next few months, and possibly even the next few years, it is interesting to think about the following: The United States is 4% of the global population, 25% of global GDP, 55% of global profits and near 70% of the global equity market capitalization. The US made up roughly 50% of the global equity market capitalization a decade ago. How much further can these dynamics stretch?
Even non-US investors have flocked to US equity markets recently. Ed Yardeni recently noted that “over the past three months, foreigners purchased US equities at a record pace of $76.5 billion. One note of caution: Their buying has a record of being a contrary indicator. They tend to be big buyers right before bear markets” (source @neilksethi).
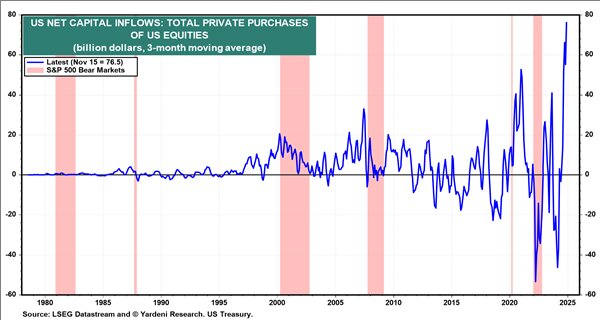
Source: Yardeni Research
The strong US dollar has been a headwind for US investors investing capital outside of the US for over a decade. And the move higher in the USD index since the election has been pronounced. The Trump Administration’s “America First” policies, tariffs, US Tech exceptionalism, stronger growth in the US relative to the rest of the world, and higher interest rates in the US versus virtually all other developed countries are all supportive of the greenback.
Given all of these “obvious” factors, most investors are heavily positioned for further strength in the US dollar. And every time Trump opens his mouth about Tariffs the US dollar moves higher. However, an unexpected catalyst, such as a couple of relatively benign inflation readings or global growth improving relative to the US, could cause a rapid unwind of this trade. “The US dollar is trading 23% above fair value, the largest divergence on record”, according to BofA Global Research (source: @kobeissiLetter). Equity markets will likely display an increased sensitivity to moves in bond yields and exchange rates than they have at various times over the last year.
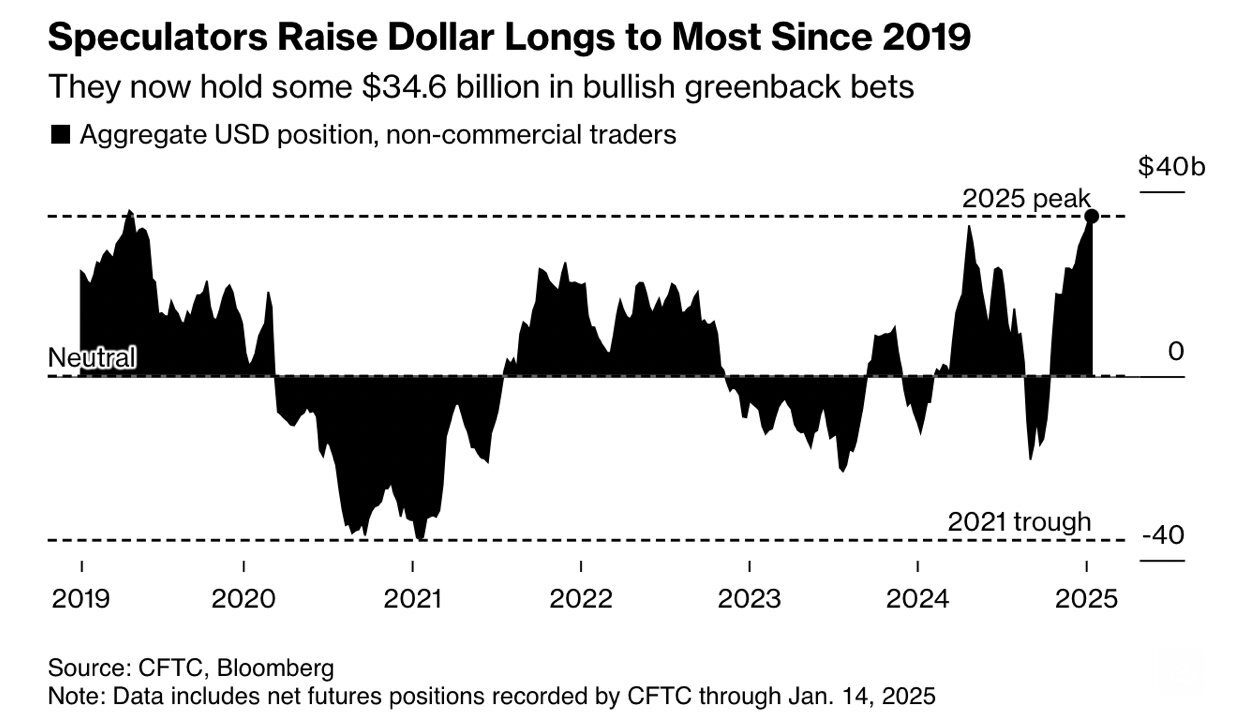
Source: Bloomberg
Finally, it was not long ago that investors dreamt of being able to achieve 4.5% – 6% yields from high quality investment grade fixed income. Although this is the reality today, many investors seem uninterested in deploying capital into this asset class. The poor performance investors have experienced in fixed income investments over recent years is undoubtedly a significant factor influencing their negative sentiment towards bonds. Jim Bianco of Bianco Research pointed out that the rolling three-year return from US Long Term Bonds is the worst stretch in 180 years.
One of the great underpinnings to the 2009 – 2021 equity bull market was the fact that stocks were fundamentally attractive relative to the historically low bond yields we experienced during that time frame. Now that bond yields have normalized, while equity valuations have continued to drift higher, the Equity Risk Premium for the S&P 500 is below 0, for the first time since the tech bubble (source: MBL Advisors & FactSet).
Theoretically, the Equity Risk Premium is the excess return investors should expect to hold (volatile) equities, over 10-year US Treasury Bonds. This metric now states that investors are no longer being compensated to own large cap equity indices, as they can earn a similar return by holding nearly risk free 10 Year Treasury Bonds.
Having said this, we believe the Equity Risk Premium is a somewhat flawed metric in the sense that bonds don’t have two important traits which US Large Cap equities exhibit in a meaningful way. First, equities are a real asset, and thus a good hedge against inflation, over longer time frames. If inflation and nominal growth have a higher resting heartbeat, as they have since COVID, this metric could be overstating the attractiveness of bonds relative to stocks. Second, the S&P 500 has an increasing amount of exposure to “innovation”, which is a primary source of the currently high valuations, while fixed income clearly has no upside optionality.
6. 2025 S&P 500 Forecasts
As we have stated in the past, we are grateful not to have to play the thankless game of publishing S&P 500 targets. Charlie Biello of Creative Planning noted that PE multiples expand or contract by at least 10% in 70% of calendar years. Outside of major economic turning points, Wall Street is fairly good at forecasting earnings estimates for corporate America. However, forecasting valuations for the market has been nearly impossible, especially during this era of excess liquidity. Nobody believed the S&P 500 would trade back to multiples we witnessed during the COVID mini bubble, but that is precisely what happened in 2024 for US Large Cap equities.
Entering 2025, most strategists are extrapolating the S&P 500 trading at 22x forward earnings as the “new normal” at least for the time being. However, history says investors should bet on the S&P 500 trading either above 24x NTM EPS (this seems very difficult to imagine, but so did getting to these valuations in the first place) or below 20x NTM EPS by the end of this year. Holding 2026 earnings growth steady at today’s forecast, this would mean that there is a 70% probability that the S&P 500 finishes 2025 either below 6000 or above 7200. Of course, most strategists’ forecasts squarely between these two bookends. This serves as a good reminder that the stock market is far more volatile than its underlying fundamentals.
| Statistic | Average % Return the Following Year | % of Positive Years | Sample size | Data Since | Source |
|---|---|---|---|---|---|
| The S&P 500 does not close below its 200 Day Moving Average in a given calendar year (2024) | 4.62% | 55.00% | 11 | 1950 | Bespoke Research |
| Year 3 of a Bull Market (Nov 2024 – Nov 2025) | 4.80% | 67.00% | 12 | 1932 | Strategas Research Partners |
| Year after two Positive Years in a row | 5.20% | 67% | 18 | 1936 | BofA Global Research Stephen Suttmeier |
| Decennial Cycle Year 5 | 20.70% | 92% | 14 | 1885 | NDR Research |
| Stock Performance after Years with over 50 Record Highs (2024) | -3.00% | 28% | 7 | 1928 | NDR Research |
| Year 1 of Presidential Cycle (2025) | 6.60% | 58% | 14 | 1928 | BofA Global Research Stephen Suttmeier |
| Positive January in Year 1 of Presidential Cycle (2025) | 13.90% | 79% | 14 | 1928 | BofA Global Research Stephen Suttmeier |
| Presidential Cycle Year 1 (2025) following up years in both Year 3 (2023) & Year 4 (2024) | 1.90% | 63% | 8 | 1936 | BofA Global Research Stephen Suttmeier |
| 4 Straight days with more than 70% of S&P 500 stocks advancing (1/19/25) | 10.63% | 92% | 12 | 1990 | Seth Golden |
| S&P 500 has at least 4 losses > -1% in days within 30 days of a Record high (January 2025) | 9.90% | 70% | 20 | 1928 | Sentiment Trader |
7. Inflation
As inflation fears creep back into the headlines, criticizing the Fed for being too Dovish has become popular again, although it was only four short months ago when many of these same prognosticators believed the economy was weakening and the Fed was too tight. The Fed began their cutting cycle in September 2024 by reducing the Federal Funds rate by 50 basis points. Since then, they have made two additional 25 basis points cuts to their policy rate. The unique thing about this cutting cycle is that the 10 Year Treasury yields have increased by roughly 1% since the Fed began their cutting cycle. A 200-basis point steepening between the Federal Funds Rate and the 10-year Treasury, four months into a cutting cycle, is unprecedented.
Bond yields accelerated their assent higher when Federal Reserve Chairman Powell mentioned that their “inflation forecasts have kind of fallen apart” in his press conference after the December FOMC meeting. In addition, the minutes from the December FOMC meeting show that most voting members believe that inflation risks are to the “upside” relative to the FOMC’s base case forecasts for inflation over the coming year. This is in stark contrast to the minutes from their September meeting when most FOMC members believed that inflation risks were “balanced” (source Neil Dutta & Renaissance Macro). Neil Dutta, Chief Economist at Renaissance Macro, pointed out that it is very clear what is occurring, which is the Fed is incorporating Trump’s tariff plans into their forecasts, despite Powell being adamant about the fact that they are strictly “data dependent.”
The trend for rising inflation forecasts has not slowed much in 2025, as the ISM prices paid by purchasing managers index (leading indicator for CPI) hit a 22-month high.
All of this is happening while the money supply (M2) is beginning to accelerate again. Possibly the greatest economist of all time, Milton Freedman, is famous for saying that “inflation is always and everywhere a monetary phenomenon.” This is to say, inflation is always as simple as an increased amount of dollars chasing the same amount of goods.
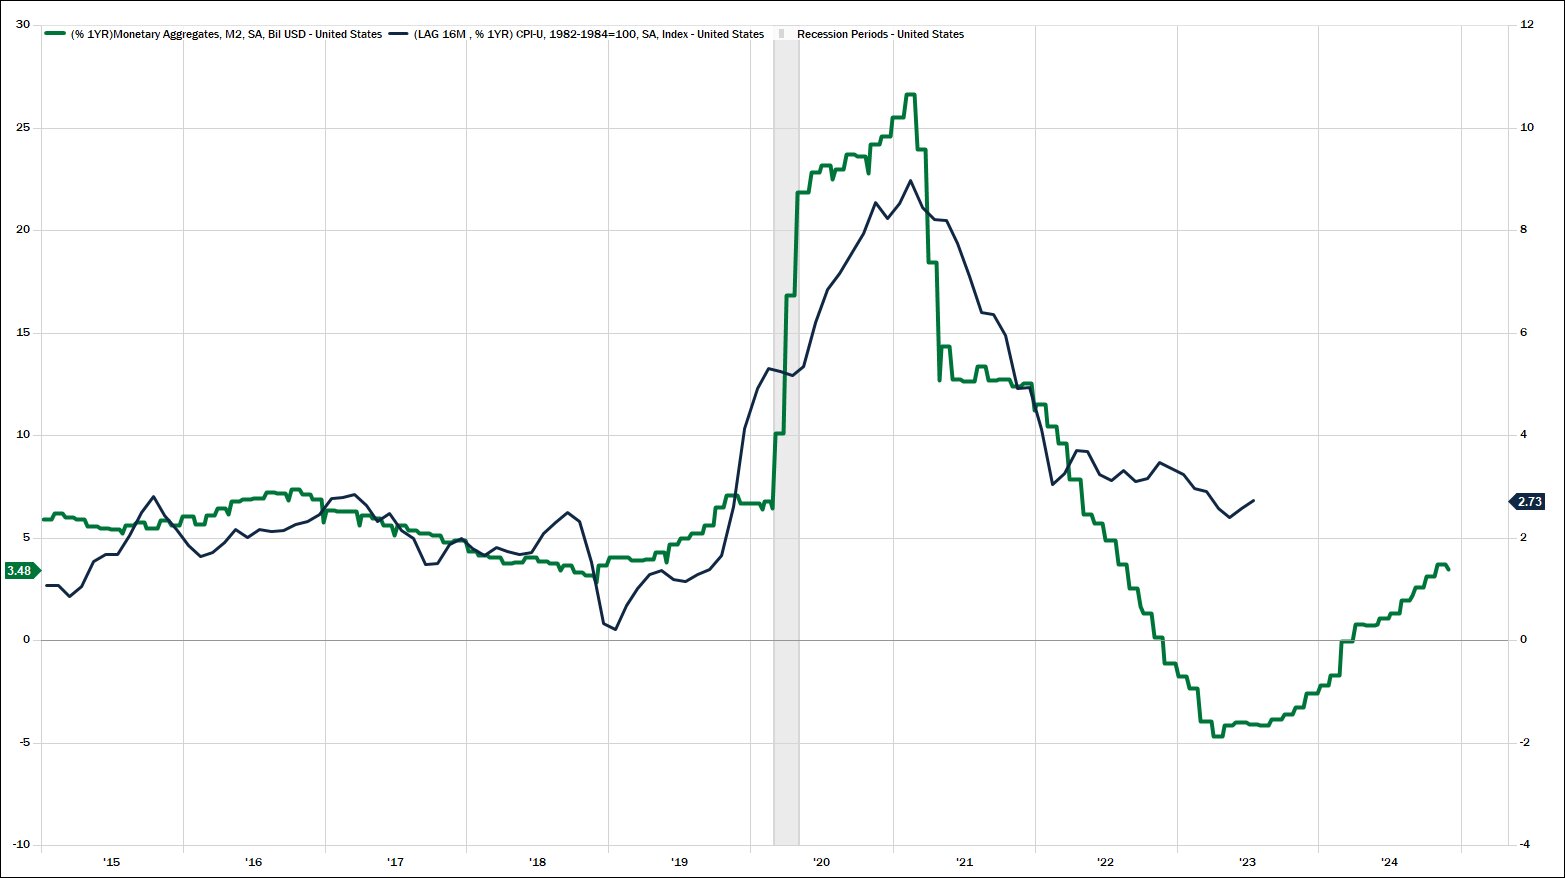
Source: MBL Advisors & FactSet
For two years, Don Rissmiller of Strategas Research Partners has been mentioning that there is an 87% chance for developed economies to have a second wave of inflation once a given economy experiences a first significant bout of it. The now famous chart below comparing the current path of inflation vs. the 1970’s (dual scale) shows that a second wave of inflation would begin in 2025 if the 1970’s roadmap was followed again.
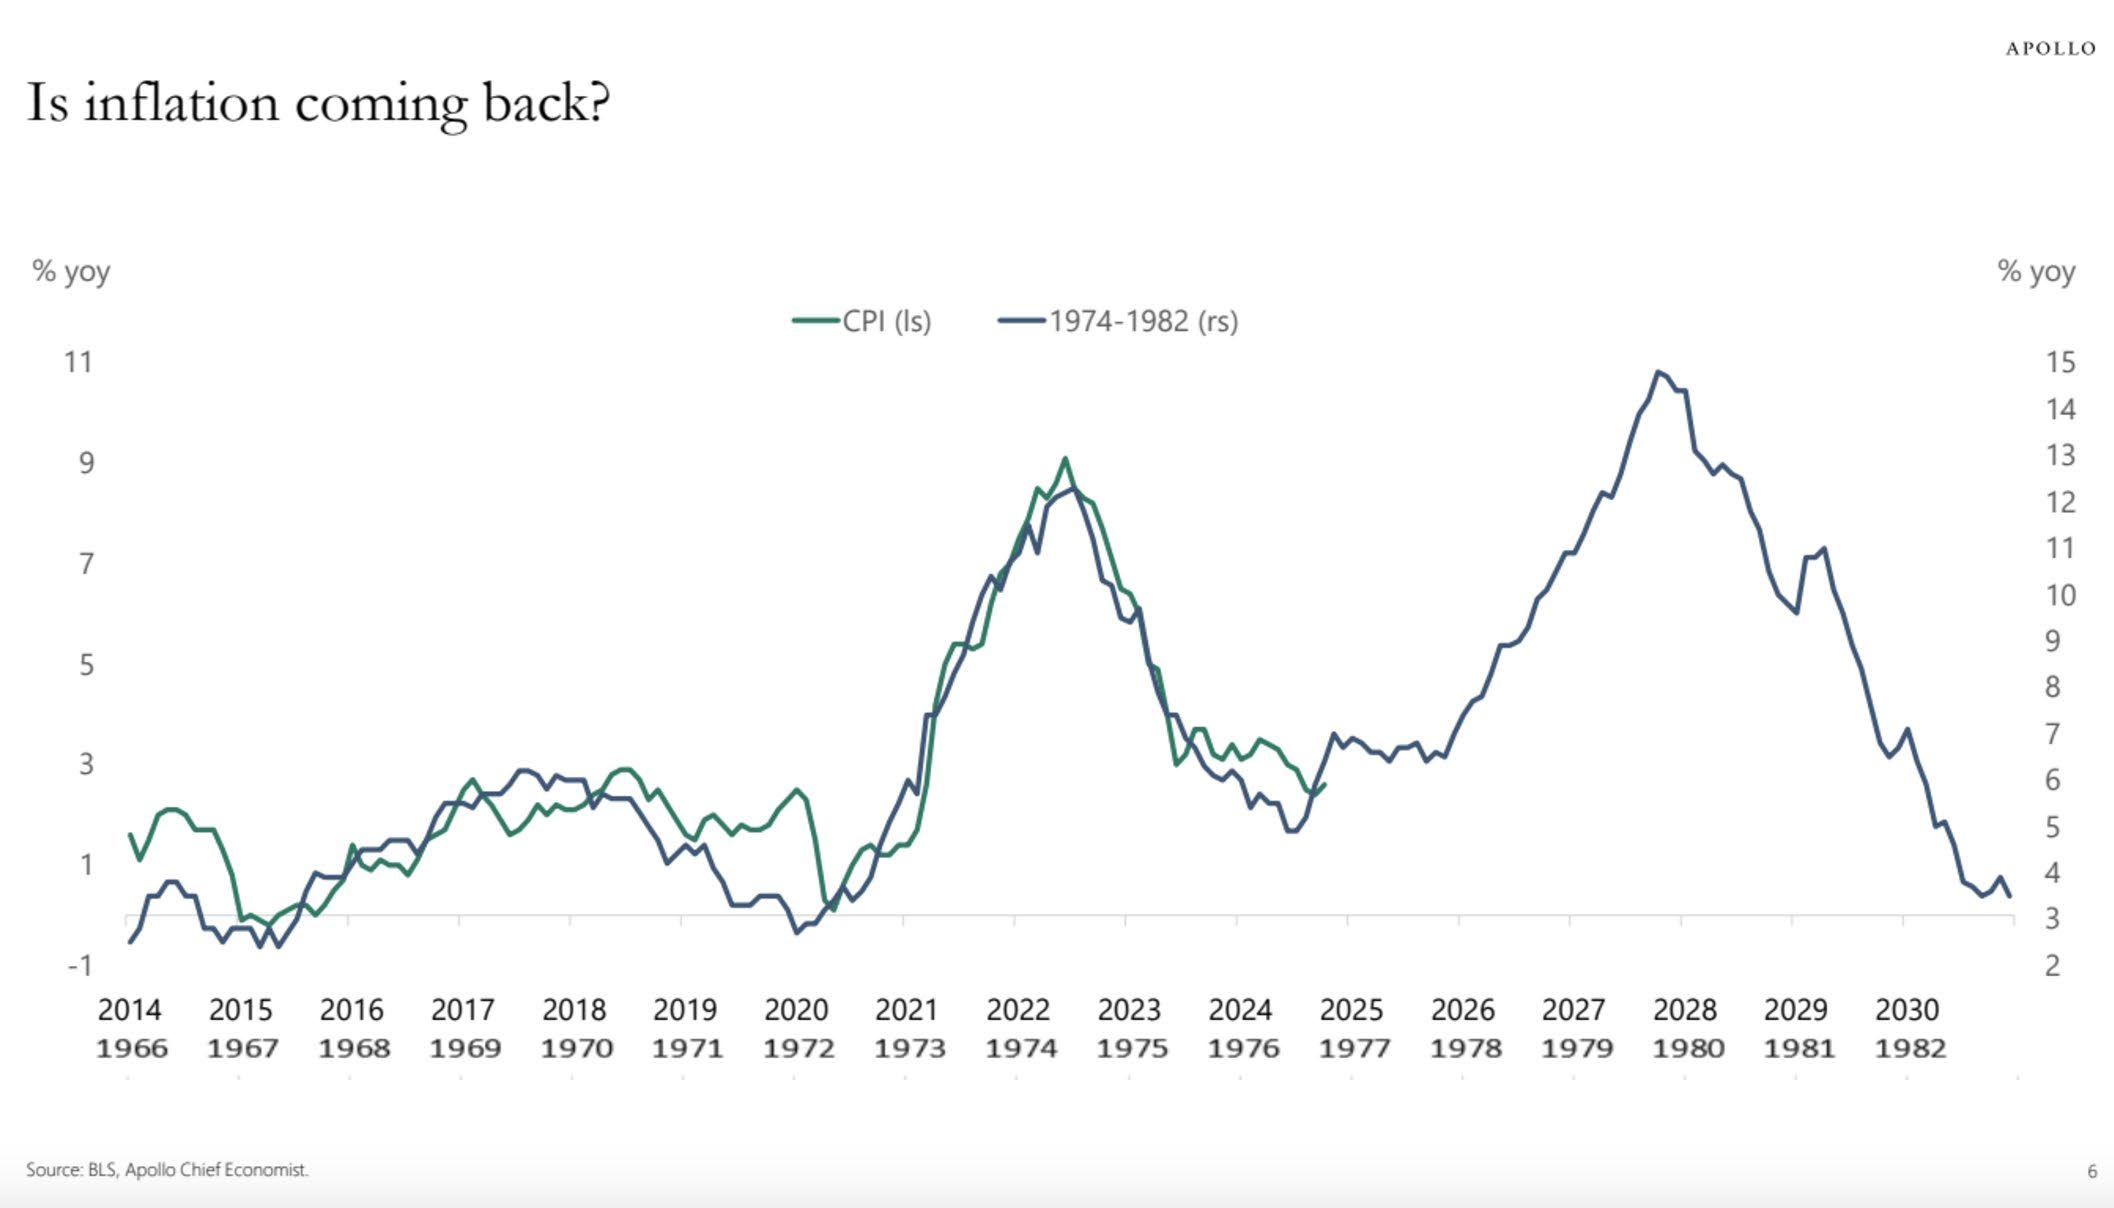
Source: Apollo & Torsten Slok
Although we believe there is plenty of credence to the narrative that inflation will remain sticky and elevated above the Fed’s 2% stated target, we also believe the second wave of inflation thesis is overblown, at least for the next six to nine months.
Neil Dutta from Renaissance Macro believes the job market is showing some signs of softening underneath the surface. Not necessarily to problematic levels for the economy, as layoffs remain low, but the quits rate is down to 2.1%, the lowest level since April 2015 (excluding the spring of 2020). The quits rate is a terrific leading indicator for wage growth. Dutta stated that “the continued slide in the quits rate implies little need for firms to pay up workers; thus, I would anticipate continued slowing in compensation growth in the quarters ahead.” Dutta went on to mention that ISM prices paid reflect tariff fears, not underlying inflation, and new job postings remain weak.
Dutta is one of many economists who have noted that the housing market cannot handle 7% mortgage rates. Home building stocks are not trading well, as new home inventories continue to grow. This thesis was collaborated on January 23, 2025, when the BLS All tenant Rent Index, a leading indicator of shelter inflation, hit fresh cycle lows of 3.18%. Dutta went on to mention that the New Tenant Rent Index actually contracted by -2.4%. Dutta stated that the NTR is often directionally accurate but can overstate the degree of change at times. The bottom line is that if shelter inflation cools to the degree that Dutta and some other economists expect, there could be downside risks to inflation relative to consensus expectations in the months ahead.
8. The Culprit for Rising Bond Yields: Washington DC & Stronger Economic Growth
Basic fixed income principles dictate that economic growth expectations and inflation expectations are the primary drivers of bond yields, aside from the very short end of the yield curve which the Fed controls.
Newfound beliefs regarding a resurgence of inflation have caused some investors to use the rise in bond yields to support their inflation claims. To be fair, 5-year breakeven rates are up more than 50 basis points since Fall 2024, but those were the cycle lows, and 5-year breakeven rates are hovering around 2.5% today, which seems like a very reasonable level of inflation expectations for the next several years.
In our opinion, the larger issue for bond yields is that investors are rightfully demanding an increased term premium to hold longer dated bonds given the higher levels of uncertainty associated with such maturities. In this regard, the abnormally flat yield curve we have witnessed for a large portion of the last 15 years was largely an anomaly, and a byproduct of hyperactive central bank intervention.
Jason Trennert from Strategas Research Partners recently wrote: “to the extent to which all Presidents, Democrat or Republican, grease the skids for their re-election, it was not particularly surprising that the Biden Administration used its powers to boost the economy and the financial markets. But the sheer range of tools used – the TGA, the SPR, student loan forgiveness, the Treasury Department’s suspension of the coupon issuance, not to mention a budget deficit of nearly 7% of GDP – was, indeed, breathtaking and unprecedented for an economy near full employment. With a debt ceiling debate looming and the Fed’s reverse repo facility falling to $240B from $2.5T at the start of 2023, there is a chance that the long-term interest rates could rise simply on the supply issuance alone. In short, the Trump Administration is inheriting an economic mess if it is serious about putting the country on a more sustainable fiscal path.”
An oversimplified rule of thumb is that 10-year Treasury yields should loosely track the rate of Nominal GDP growth over time. In this regard, 4.5% +/- 10-year bonds yields are not elevated, relative to the current growth rate of the economy.
9. The Ultimate Disruptor
We may have never publicly written about such a polarizing subject as President Trump. We recognize the people reading this will have wide ranging viewpoints regarding the President, and thus we will strive to remain as objective as possible. In this regard, we will begin with two important reminders:
Stocks have done well regardless of who the President has been throughout history. The exceptions to this rule are Hoover & FDR during the Great Depression and George W. Bush, who began his presidency with the biggest asset bubble in the history of our country and ended with the largest financial crisis since the 1930’s.
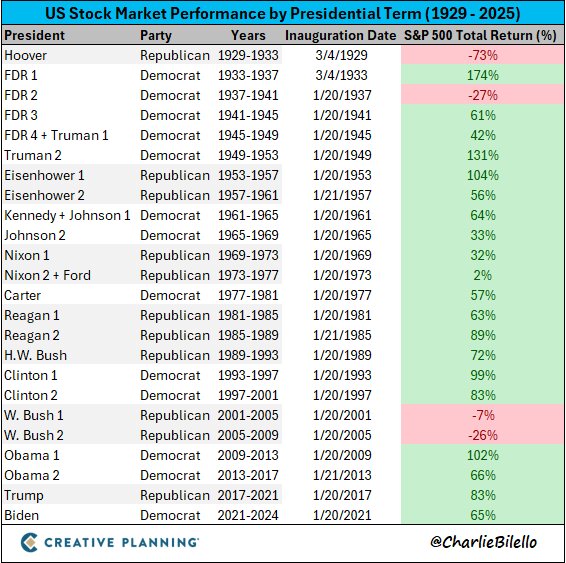
Source: Charlie Bilello & Creative Planning
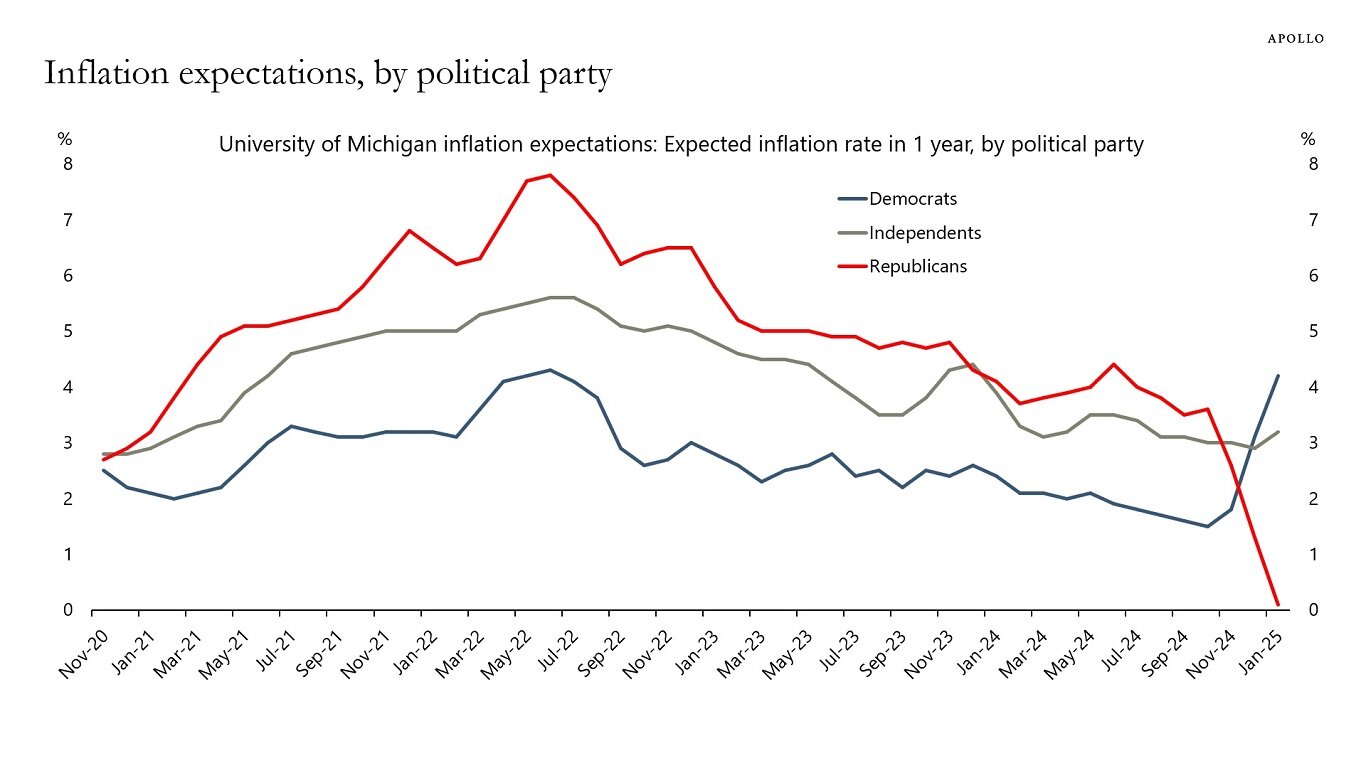
Second, recognizing our own biases is a useful trait in investing. According to the University of Michigan survey on inflation expectations, Republicans’ expectations for inflation have crashed since the election. This comes after two straight years when Republicans’ expectations for inflation were well above most official inflation metrics. Conversely, Democrats’ expectations for inflation have spiked since the election. This contrasts with the last four years when Democrats’ expectations for inflation were below most official inflation readings, with the wisest gap of expectations versus reality occurring during the summer of 2022.
Source: Apollo & Torsten Slok
We highlighted the partisan dynamics in this inflation survey as a reminder to not let politics blind us as investors, in either a bullish or bearish sense. Most experts believe that Trump is inheriting a relatively low bar when it comes to improving business-friendly economic policies. Conversely, the bar is quite high, in the opinion of the market, as to how effective his pro-growth policies might be.
It has only taken a week with President Trump back in office for us to be reminded how aggressive he is in pursuing his policy agenda. Both humans and markets alike often hate uncertainty more than bad news itself. Trump is the ultimate disruptor, and this will likely cause volatility in markets in the months and years to come.
- Immigration policy had major issues under the Biden administration. But all else equal, immigration is a driver of economic growth. Convicted felons will likely be deported. But deporting 20M people would cause an economic depression. Trump has been quick to show some action on this issue, since it was such a hot button during the election. Press Secretary Karoline Leavitt was recently asked “how many of the migrants that were deported have a criminal record?” She replied “All of them. Because they illegally broke our nations laws.” If the Trump Administration is serious about rounding up every single illegal immigrant that they are capable of finding, this could be an underappreciated risk to growth.
- Economic growth is extremely important, but upholding the “rule of law” is equally as imperative. A strong rule of law is one of America’s great advantages. A revamped, merit-based immigration policy seems incredibly logical. Elon Musk has been vocally supportive of this.
- Trump is very transparent as to how he views tariffs: as a way to generate revenue, as part of an America First policy, and as a negotiating tool.
- Trump has generally slow played tariffs relative to fears thus far, as they have only been used as a negotiating tool on non-economic issues. Clearly, this will evolve.
- Investors are at least mildly obsessed with tariffs and will view them as a risk-off event if they happen on a large scale or scope. Nucor’s CEO recently stated that “we saw the memo on tariffs. I think they’re going to be far-reaching and broad” (source: cnbc). To some degree, tariffs are the epitome of a “known risk,” but capital markets will constantly need to recalibrate given the wide range of possibilities regarding the size to which the Trump Administration will implement them in the months ahead.
- On 1/27/25, both President Trump and Treasury Secretary Bessent stated that they would like to abolish the Federal Income Tax. Love it or hate it, this seems incredibly farfetched. Nonetheless, Trump has noted on several occasions that be believes the most prosperous time in the United States was the late 1800’s and early 1900’s when there was no Federal income tax and when government revenues came from excise taxes and tariffs.
- Jason Trennert has often said that we need to remember that Trump is a NYC Real Estate mogul at heart. Thus, a lot of his rhetoric can be part of a hardnosed negotiating posture. We are unsure whether Trump actually believes it is possible to eliminate the Federal income tax. Regardless, we are nearly certain that Trump would like to further cut personal and corporate tax rates. Lowering the corporate tax rate from 35% (which was the highest in the developed world) to 21%, during Trumps first term, created a boom for corporate America and government tax receipts alike. It’s unclear if further tax cuts would have the same effect, especially given the size of the current budget deficits.
- Since Trump clearly wants to lower tax rates, tariffs may become somewhat of a necessity, as a revenue driver, according to our understanding. This would all a part of what Trump sees as a great “rebalancing.” Yes, prices of certain imported goods will go higher. But consumers will have more money in their pockets and theoretically, American industries that have been undercut by cheaper imports would have somewhat of a renaissance. In an ideal world, stronger demand would create more jobs and eventually higher wages, as well as a shrinking trade deficit. (We don’t necessarily agree or disagree with this line of thinking; we are just reiterating some of what we have read.) Of course, most of this goes against traditional economic models. This will likely not be a “smooth process,” regardless of its ultimate effectiveness. Extremely high risk / reward.
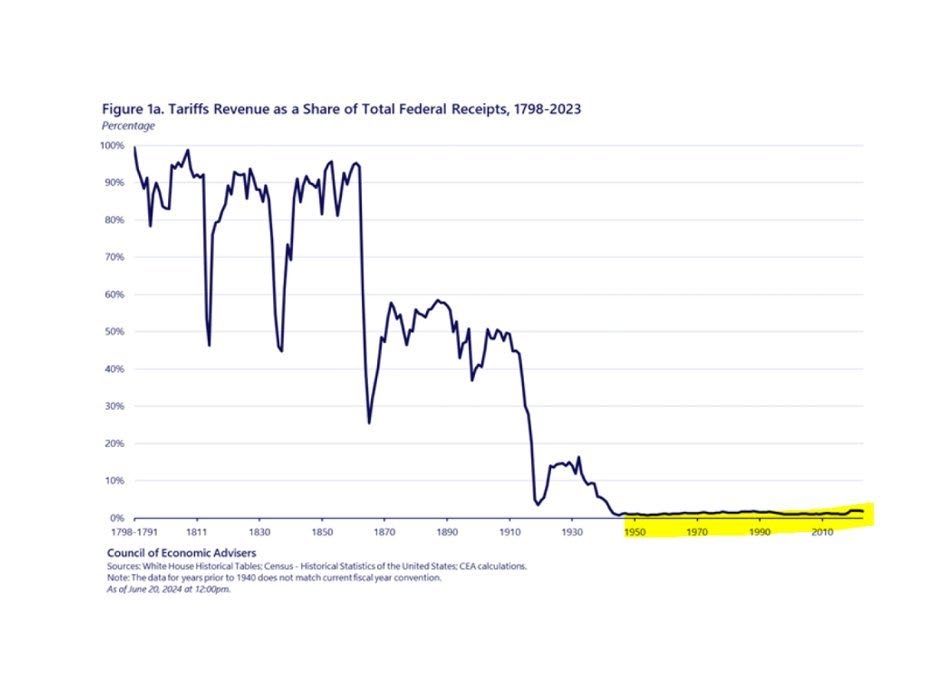
Source: Council of Economic Advisors & Marc Andreessen
- Deregulation is effectively a tax cut for corporate America, especially small business. This policy shift is underappreciated by investors in our opinion.
- How effective or destructive will DOGE be? DOGE is already claiming that they are saving $1B per day. Their goal is to save $3B+ per day. Brian Wesbury, Chief Economist at First Trust, notes that economic growth has continually slowed as government spending as a percentage of GDP has consistently increased since 1965 when Lyndon Johnson pushed through the “Great Society” programs.
- In his first full day back in office, Trump announced project “Stargate,” a $500B AI infrastructure project. AI is both a source of potential economic growth (productivity) and national security. Days after this announcement, the DeepSeek development has caused some uncertainty around the size of this investment.
- Stanley Druckenmiller is, in our opinion, the single greatest investor of all time. On Inauguration Day he stated “I’ve been doing this for 49 years, and we’re probably going from the most anti-business administration to the opposite. We do a lot of talking to CEO’s and companies on the ground, and I’d say CEO’s are somewhere between relieved and giddy.” At the same time, Druckenmiller continues to believe US equity markets are expensive and is extremely concerned with the United States debts and deficits.
Uncertainty around Trumps policies will likely cause some uneasiness for investors at various times this year, as they are the epitome of unconventional in many ways. Having said this, many of the policies which became “normalized” over the last 15 years were moving towards an unsustainable path, most notably the trajectory of government spending.
10. Artificial Intelligence
AI capabilities are rapidly evolving and have been an increasing underpinning to the US equity markets since ChatGPT was first released in November 2022. Monday 1/27/25 seemed to be a milestone day in the evolution of AI as the Chinese startup DeepSeek launched its latest AI chatbot. The massive buzz around DeepSeek is concisely summarized by Peter H. Diamandis, MD:
- “We know AI is moving faster than anyone predicted. While giants like OpenAI (4,500 employees & $6.6B raised in capital) have spent billions training their models, DeepSeek as a 200-person startup from China just built an AI system matching GPT-4 for 20x less money” (source: @PeterDiamandis).
- Traditional AI uses 32 decimal places. DeepSeek proved 8 is enough. The result is 75% less memory needed (source: @PeterDiamandis).
- DeepSeek is 2x faster while maintaining a 90% accuracy. DeepSeek reads entire phrases at once versus traditional AI read text word by word (source: @PeterDiamandis).
- Rather than one AI trying to know everything (think of one person trying to be a doctor, lawyer and engineer simultaneously), DeepSeek built a system of specialists. Traditional models have 1.8T parameters always active. DeepSeek has 37B active at once (out of 671B total). (source: @PeterDiamandis).
- It’s all open source. Anyone can verify, build upon, and implement these innovations. This is AI democratization. The barriers to innovation just got obliterated. (source: @PeterDiamandis).
Most experts do not believe DeepSeek trained their new models with the modest costs and technology which they claim. In fact, the Financial Times reports that DeepSeek likely spent over $500M on Nvidia chips, despite their low-cost claims. Regardless, even modest cost and efficiency improvements around AI are a positive development. Even Nouriel Roubini, who often finds a way to have a pessimistic viewpoint on economic issues wrote: “In my modest opinion the DeepSeek surprise / shock is – counterintuitively – over time bullish for US and global stocks as it is another positive global aggregate supply shock that increases US / global potential growth and makes exponential AI even more exponential” (source: @Nouriel).
Microsoft’s CEO Satya Nadella elaborated “Jevons paradox strikes again! As AI gets more efficient and accessible, we will see its use skyrocket, turning it into a commodity we just can’t get enough of” (source: @satyanadella).
Dan Niles, the famous hedge fund manager and founder of Niles Investment Management, shares some of his opinions on X after the DeepSeek news.
- “I continue to believe there is an AI CAPEX digestion phase in CY2025 and AI CAPEX spending is going to grow 10-20% versus the 50-60% growth seen in CY2024. DeepSeek’s recent R1 announcement of training it for $6M makes this case even more likely” (source: @DanielTNiles).
- “March 2024 – Sequoia, which is a prominent VC investor in the AI space including a lead investor in the seed round for NVDA in 1993. Sequoia estimated that the AI industry spent $50B on the Nvidia chips used to train advanced AI models in 2023 but brought in only $3B in revenue” (source: @DanielTNiles).
- Although Niles believes there could be a digestion phase in AI CAPEX, especially from the hyperscalers, and possibly their stock prices as well, he stated “I believe we are years away from any ultimate AI overbuild peak occurring during the inference phase of CAPEX, but we will not know that until time passes much like back during the internet buildout” (source: @DanielTNiles).
It is interesting to note that on their earnings calls on 1/29/25, Microsoft validated the narrative that their growth rate in AI spending is set to slow in the years ahead (not cutting CAPEX, but slow growth). Conversely, META said it is full speed ahead with regards to their AI CAPEX, noting that “the ability to build out this kind of infrastructure will be a major advantage” (source: @TheTranscript).
The evolution of AI is moving so rapidly even the experts seem to be having trouble keeping up. The sheer speed of progress will often leave investors with more questions than answers at times. How will the massive AI CAPEX spending ultimately be monetized (beyond the AI infrastructure companies who are the beneficiaries of the CAPEX such as NVDA, AVGO, etc.)? The estimates for increased energy sources to power the data center build outs are nothing short of staggering. But does the increased energy efficiency displayed by DeepSeek alter these estimates? What industries will most effectively use AI as a tool to increase their product offerings and their profit margins? Regardless of these questions, AI only seems to be further solidifying itself as a massive trend for the next several years. The broadening benefits of AI should be a positive development for the global economy in the decade ahead, especially given the aging demographics across the developed world.
Conclusion
The next few years will likely be an incredibly different market environment than the last few, and there seems to be an endless list of potential catalysts which will impact capital markets in the months ahead.
US equity markets seem to be trading in a more extreme fashion since COVID. Markets move more quickly, valuations seem to be near irrelevant over short time horizons, and speculation has become somewhat normalized across certain asset classes.
Very few investors would disagree with the claim that animal spirits are running wild at the moment, and a day of reckoning will come for some of these issues eventually. At the same time, we are in a bull market until proven otherwise and fighting the prevailing trends within markets has rarely been a profitable strategy for investors. Don Rissmiller, Chief Economist at Strategas Research Partners, recently published a report titled “The U.S. Economy Doesn’t get in big Trouble until Profits fade.” This says nothing about the direction of the next 10% move for equity markets. But it is a great reminder that bear markets and recessions occur when corporate profits are contracting, or at least flatlining. The profitability profile of corporate America is strong, despite an unsynchronized economy. Interest rate sensitive parts of the economy such as durable goods, housing, and corporate deal activity have remained depressed for the better part of the three years and could offer fresh upside catalysts.
Despite the government’s spending antics, consumer and corporate balance sheets have massively repaired themselves since 2008 and remain in solid shape today. According to JP Morgan’s Guide to the Markets, US consumers have nearly $190 Trillion of assets and $21 Trillion of liabilities. Torsten Slok of Apollo stated that the household debt to asset ratio is at a 50-year low. Slok continued to note that US nonfinancial corporate net interest payments are near record low levels.
The third year of a bull market can often be somewhat of a digestion phase for markets. At the same time, numerous sectors of the market are expected to finally experience reaccelerating earnings growth, and expectations don’t seem overly demanding outside of the US exceptionalism trade that has worked so well for the last two years.
With earnings growth on solid footing, rhetoric from policy makers, and their corresponding impact on interest rates seem to be front and center to begin this year. In this regard, it is important to note that stocks and bonds have largely become positively correlated since COVID, which is a drastic change from the prior 30+ years. Because of this, maintaining or even increasing diversification within portfolios is more important than ever. Historically, bonds are not the best asset classes when inflation levels are elevated, but they do provide ballast to portfolios for the first time in several years and could even hold their own relative to US Large Cap equities if the less optimistic forecasts from Goldman Sachs and BofA Global Research prove to be accurate in the years ahead.
We believe Uncorrelated Assets are an increasingly attractive asset class, both for diversification purposes as well as their expected return profiles. For clients with a tolerance for illiquidity, private investments should warrant serious consideration as a potential addition to portfolios.
Like many investors, we are rooting for the expected broadening of fundamentals and corresponding performance from various asset classes. Dennis DeBusschere of 22V Research recently wrote: “Historically, lower unemployment readings favor more Risk-on and Value driven internals. Combining sensitivities to unemployment and inflation, a lower unemployment rate together with stable inflation (our call) favors Energy, REITs and Financials, while Communications, Tech and Health Care underperform. Higher unemployment and inline inflation led these sector performances to reverse. Value, Deep Cyclicals and Small Caps would work relative, along with foreign markets, IF the US exceptionalism trade reverses. To be clear, we are not short the mega caps. We are just noting that the macro backdrop driving the US exceptionalism narrative (USD going straight up) is likely to be less of a tailwind as European / China growth stabilizes. Assuming our benign tariff policy outcome is correct.”
Richard Bernstein, the Chief Investment Officer at RBA Advisors, offered some interesting perspective when he mentioned that in some instances, investors have begun to view diversification as a hindrance to upside, rather than a tool to achieve financial goals.
As always, we structure portfolios to be prepared for a wide range of potential outcomes. It is cliché to say that we expect volatility in the months to come, but aside from the fall of 2023, US equity markets have been unusually calm for the last year and a half. Regardless, Warren Buffett’s steadfast optimism in regard to the long-term prospects of America serves as a great reminder regarding the mentality of a successful long-term investor, especially when short-term discomfort inevitably arises.
Sincerely,
Brian Gift, CFA
Chief Investment Officer
MBL Advisors
Bob Farrell’s 10 Investing Rules
Bob Farrell is a legendary Merrill Lynch strategist who published his timeless list of 10 investing rules several decades ago, a version of which can be found here https://www.investopedia.com/articles/fundamental-analysis/09/market-investor-axioms.asp. It seemed some investors believed these rules were no longer as relevant as they once were when they didn’t hold true to form during the extremely abnormal bear market and subsequent recovery in 2020 and 2021. However, all of these rules seem especially pertinent today as we proceed thorough this more traditional bear market. We have written about Bob Farrell’s rules on multiple occasions in the past. But their timelessness and truth always amaze us each time we observe them.
- Rule #1. Markets tend to return to the mean over time.
- Rule #2. Excesses in one direction will lead to opposite excesses in the other direction.
- Rule #3. There are not new eras – excesses are never permanent.
- Rule #4. Exponential rapidly rising or falling markets usually go further than you think, but they do not correct by going sideways.
- Rule #5. The public buys the most at the top and the least at the bottom.
- Rule #6. Fear and greed are stronger than long-term resolve.
- Rule #7. Markets are strongest when they are broad and weakest when they narrow to a handful of blue-chip names.
- Rule #8. Bear markets have three stages – sharp down, reflexive rebound and a drawn out fundamental downtrend.
- Rule #9. When all of the experts and forecasts agree – something else is going to happen.
- Rule #10. Bull markets are more fun than bear markets.
This content was prepared by MBL Advisors and reflects the current opinion of the firm, which may change without further notice. This report is for informational purposes only and is not intended to replace the advice of a qualified professional. Nothing contained herein should be considered as investment advice or a recommendation or solicitation for the purchase or sale of any security or other investment. Opinions contained herein should not be interpreted as a forecast of future events or a guarantee of future results. Different types of investments involve varying degrees of risk, and there can be no assurance that any specific investment will either be suitable or profitable for a client’s portfolio. Economic factors, market conditions, and investment strategies will affect the performance of any portfolio and there are no assurances that it will match or outperform any particular benchmark. Commentary regarding the returns for investment indices and categories do not reflect the performance of MBL Advisors or its clients. Historical performance results for investment indices and/or categories generally do not reflect the deduction of transaction and/or custodial charges or the deduction of an investment-management fee, the incurrence of which would have the effect of decreasing historical performance results. Investors cannot invest directly in an index.
The indices referenced herein have been selected because they are well known, easily recognized by investors, and reflect those indices that the firm believes, in part based on industry practice, provide a suitable benchmark against which to evaluate the investment or broader market described herein. Although certain information has been obtained from sources believed to be reliable, we do not guarantee its accuracy, completeness, or fairness. We have relied upon and assumed without independent verification, the accuracy and completeness of all information available from public sources.
This material is provided for informational purposes only. It is not an offer or solicitation to buy or sell any securities. Past performance does not guarantee future results, which may vary. The value of investments and the income derived from investments will fluctuate and can go down as well as up. A loss of principal may occur.
MBL Advisors Inc. is independently owned and operated. Investment Advisory Services are offered through MBL Wealth, LLC, a Registered Investment Advisor. Securities are offered through M Holdings Securities, Inc., a registered broker/dealer, member FINRA/SIPC. 7592033.1
This material and the opinions voiced are for general information only and are not intended to provide specific advice or recommendations for any individual or entity. To determine what is appropriate for you, please contact your personal advisors. Information obtained from third-party sources are believed to be reliable but not guaranteed. The tax and legal references attached herein are designed to provide accurate and authoritative information with regard to the subject matter covered and are provided with the understanding that MBL Advisors Inc., is not engaged in rendering tax, legal, or actuarial services. If tax, legal, or actuarial advice is required, you should consult your accountant, attorney, or actuary. MBL Advisors Inc., does not replace those advisors. The use of trusts involves a complex web of tax rules and regulations. You should consider the counsel of an experienced estate planning professional before implementing such strategies.
MBL Advisors Inc. is independently owned and operated. Investment Advisory Services are offered through MBL Wealth, LLC, a Registered Investment Advisor. For important information related to MBL Wealth, LLC, refer to the Client Relationship Summary (Form CRS) by navigating to http://mbl-advisors.com. Securities are offered through M Holdings Securities, Inc., a registered broker/dealer, member FINRA/SIPC. For important information related to M Holdings Securities, Inc, refer to the Client Relationship Summary (Form CRS) by navigating to https://mfin.com/m-securities. Insurance solutions are offered through MBL Advisors Inc.