Category: Advanced Market Insights
Date: June 14, 2023
Bullish or Bearish?
Consistently, we think about the idea that “markets often do what causes the most amount of pain for the most amount of people”, at least over shorter time frames. The first half of 2023 has been another sterling example of this notion, as many investors remain as underweight equities as at any point since 2009, according to the June Bank of America Global Fund Manager Survey. A consensus rationale for investors in 2023 has been “why” would they own risk assets into the teeth of a “surefire” recession if short term treasuries are paying them 5%. Light investor positioning, elevated cash levels, and extremely bearish sentiment unleashed a “pain trade” to the upside for US equity markets during the first half of 2023, contrary to most of the Wall Street year ahead forecasts which believed investors would be faced with a “difficult” start to the year. Thus, we can add 1H23 to the list of countless examples of why investors are best served by sticking to their process and staying invested with a long-term mindset.
Investors can always construct compelling bullish and bearish narratives to support their thesis as to why equity markets may head higher / lower over the months to come. This dynamic is especially pertinent right now as various signals are becoming increasingly conflicting. On one hand, the weight of the economic data remains weak, and US Large Cap equities could be fully valued, even for the scenario where the economy avoids a recession. Conversely, investor positioning remains offsides (although it is less so) with FOMO beginning to set in, as technicals gradually improve for global equity markets, including some “buy signals” which favor bullish outcomes when looking out over the next 6 – 12 months.
With this in mind, we have outlined a few bearish viewpoints along with bullish counterpoints to these generally well-known bearish narratives.
Bearish Viewpoint #1: Recession
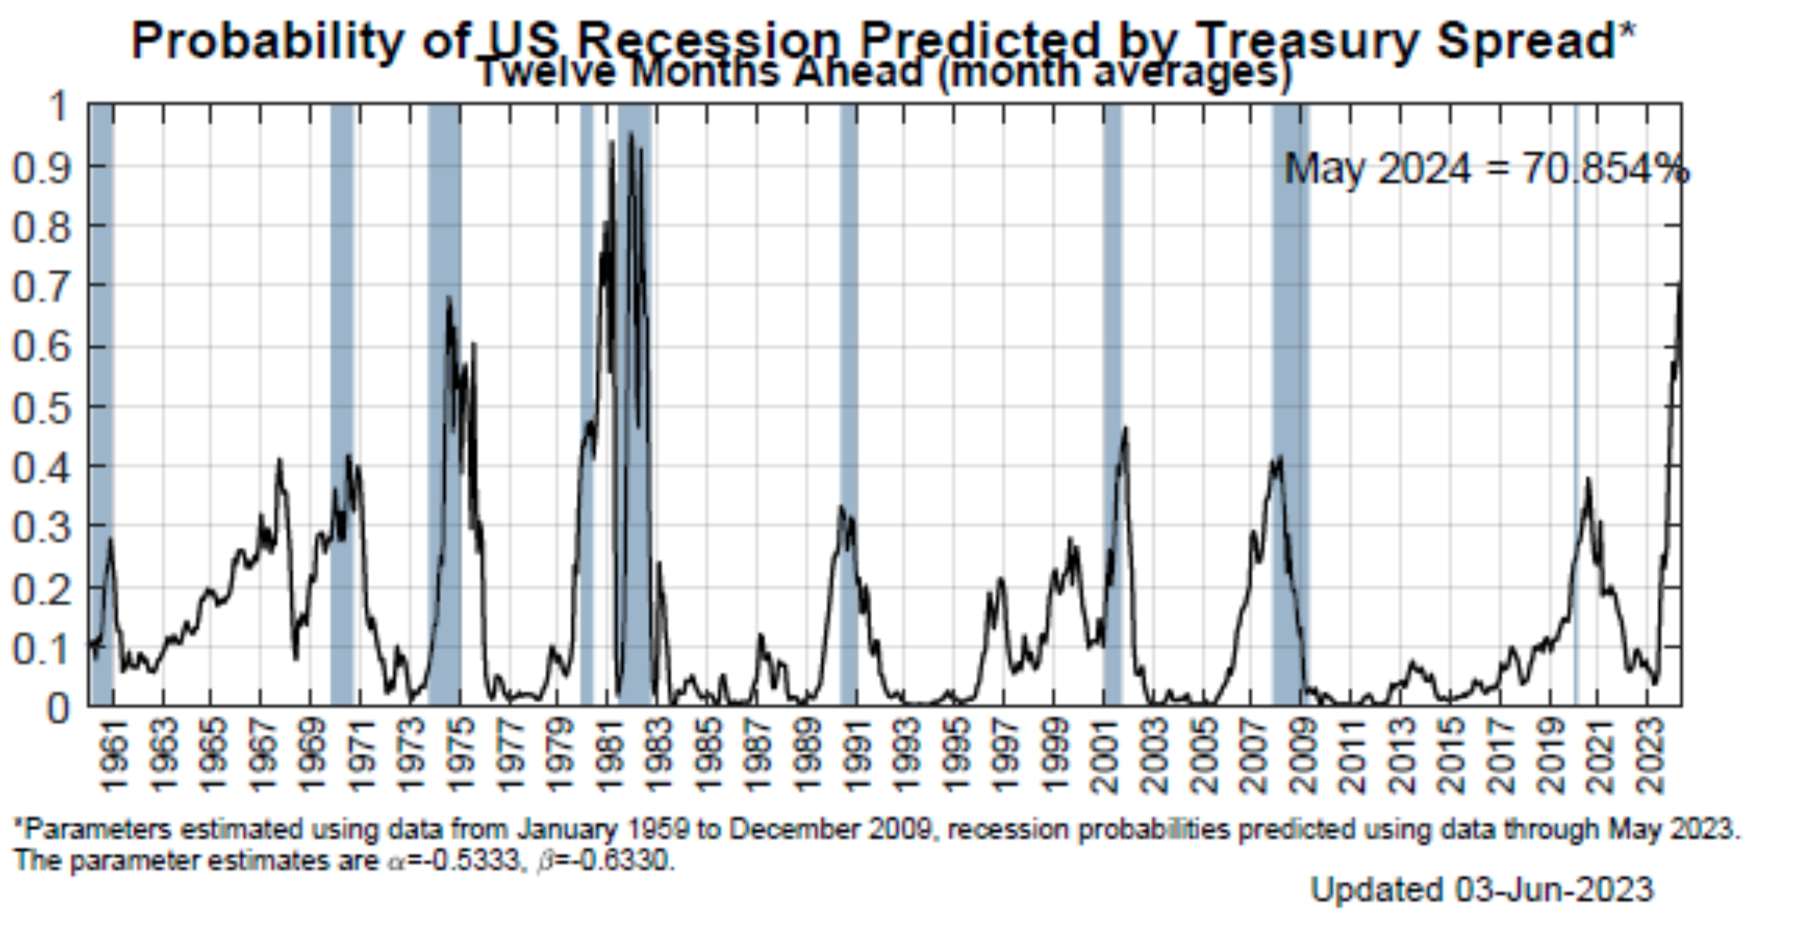
Many economists continue to believe that a recession is around the corner for the US economy. A plethora of indicators with near flawless track records are signaling that a recession will begin sometime in the next few months. Inverted yield curves are one of the more highly predictive economic indicators, and both the 10-year vs 2-year treasury yield curve as well as the 10-year vs 3-month treasury yield curve are as negatively inverted as we have seen in 40 years. In addition, since at least 1960, every time the year-over-year change in US Economic Leading Indicators (LEI’s) reached -5, the US economy went into a recession (source: MBL Advisors & FactSet). The current year over year change in LEI’s is -8 (source: MBL Advisors & FactSet).
A tight labor market has kept the consumer afloat thus far, but initial jobless claims have risen steadily since bottoming in October 2022. The 6-month moving average of initial jobless claims is about to cross the 24-month moving average to the upside, another indicator with an incredibly strong track record of predicting recessions which will signal imminently. These cracks in the labor market are appearing just as student loan payments are going to resume (avg. payment is $383 per month according to Strategas Research Partners), and this is alongside other fixed living expenses which have skyrocketed over the last few years (rents, car payments, credit card payments (with higher balances & higher rates, etc.).
The US is a consumer-driven economy, and the average consumer could be faced with a more fragile personal financial situation than they have become accustomed to over the last couple of years. The Fed’s own yield curve-based model places a 70% probability of the US economy entering recession at some point within the next 12 months.
Bullish Counterpoint #1: Rolling Recession or Soft Landing
We discussed the rolling recession scenario in our ISO from December 2022, which is exactly what has played out to this point. Economists have been talking about an “imminent” recession for the last year and a half, yet the economy has failed to “break” in any significant fashion. In aggregate, US economic data has actually been surprising to the upside according to the Citi Economic Surprise Index, and this can also be seen in a variety of individual data points such as PMI’s stabilizing, strong housing data, better than expected Durable Goods and 17-month highs in Consumer Confidence.
Not coincidentally, the “soft landing” camp has grown as equity markets have marched steadily higher since the epicenter of the regional banking crisis. Morgan Stanley’s CEO James Gorman noted that he believes capital markets activity has troughed, recently stating “I feel like we’ve bottomed on this. I just feel the tone is a little better. We’re clearly seeing more green shoots. I’m having more discussions with CEO’s.” (Source: https://www.ft.com/content/4256b07b-789f-4f87-a10e-db9db951c3c4)
On top of this, economists from Goldman Sachs and Credit Suisse echo a more optimistic economic outlook as well. Within the last month, Goldmans Sachs reduced their odds of a recession within the next 12 months from 35% down to 25%. (Source: Goldman Sachs; Why a US Recession has become less likely; https://www.goldmansachs.com/intelligence/pages/why-a-us-recession-has-become-less-likely.html.)
Just this week, Credit Suisse noted that “U.S. Recession might not hit until 2026.” They are basing this on the observation that recessions usually don’t begin until the yield curve flattens out after the inversions occur, and Treasury futures markets are not pricing this in until June 2026 (Source: https://ph.investing.com/news/stock-market-news/us-recession-might-not-hit-until-2026–credit-suisse-432SI-915754).
Clearly stock market bulls are strongly rooting for this to be one of the rare instances where the Fed can “thread the needle” and avoid a recession as they did with their 1994 / 1995 tightening cycle.
A final bullish interpretation of the current economic environment could be that this entire inflation and interest rate cycle has been part of a great “normalization” process for the economy / monetary policy, following the tremendously unnatural circumstances which policy makers unleashed in 2020 and 2021. The Atlanta Fed’s GDPNow indicator currently supplements this viewpoint as it expects Q2 Real GDP to be 1.9%.
Bearish Viewpoint #2: US Equities Are Expensive
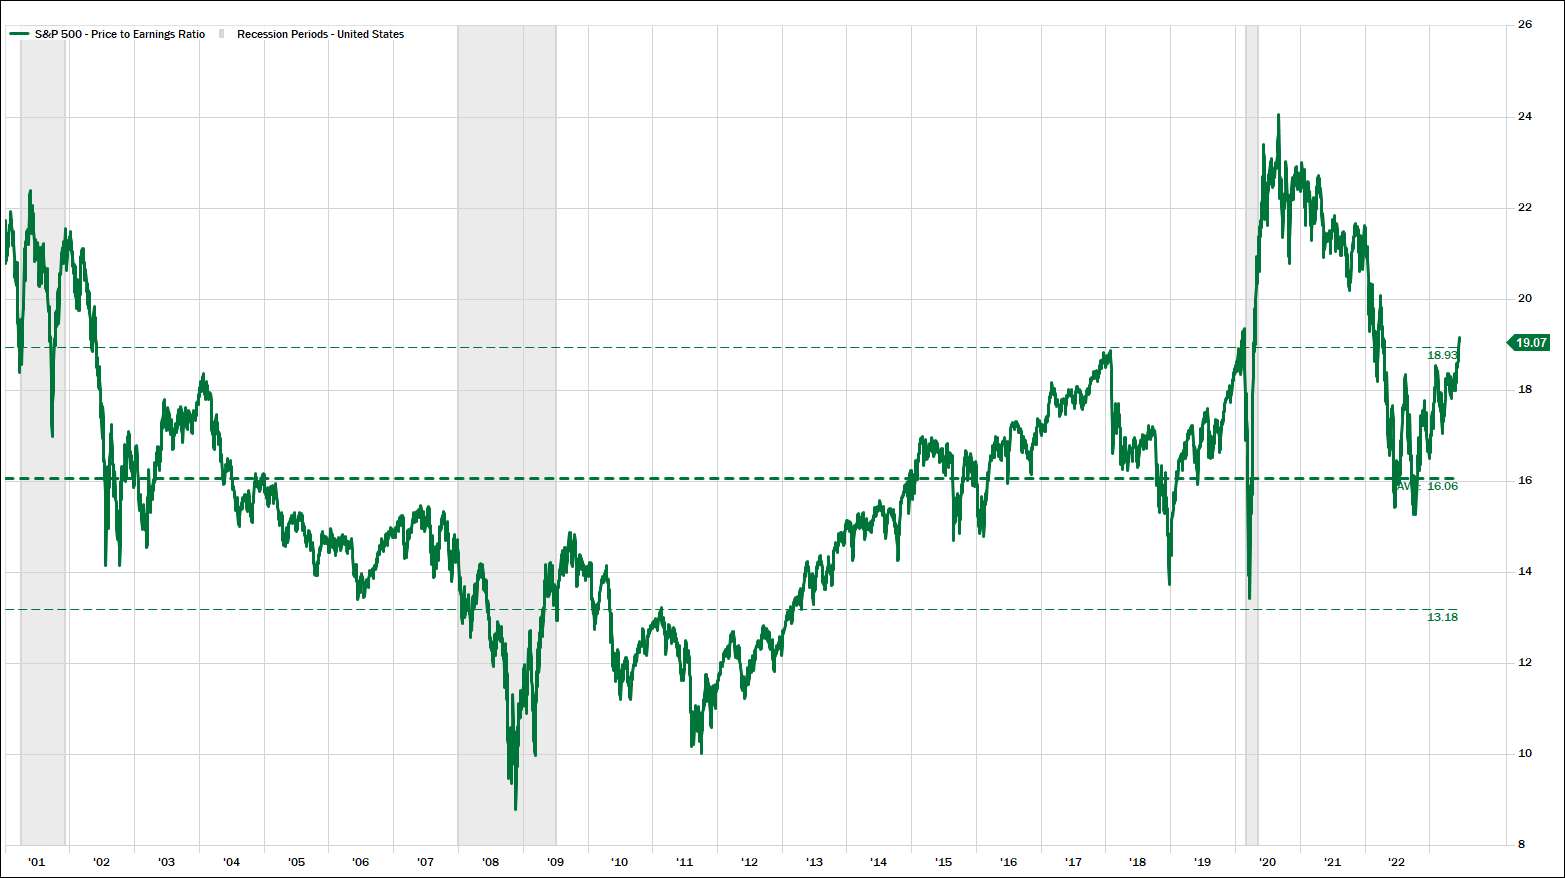
The S&P 500 is back to trading at 19x forward earnings, which is the highest level ever for the S&P 500 outside of the tech bubble or the COVID bubble (Source: MBL Advisors & FactSet). This is also the exact multiple of forward earnings the S&P 500 peaked at in January 2020 just prior to COVID. 2022 made significant progress in correcting excess valuations throughout all types of asset prices (except housing in some parts of the country). At the October 2022 lows, the S&P 500 traded around 15x forward earnings estimates (down from the COVID peak of 24x forward EPS). Although far from perfect, starting valuations are very good at helping to predict longer-term forward returns. Even if corporate earnings continue to stabilize and the economy avoids a recession, investors are left questioning how much “good news” is already priced into risk assets, especially if corporate earnings don’t reaccelerate to the upside. At 19x earnings, the thesis for incrementally owning the risk-free asset, yielding over 5%, only increases in validity.
S&P 500 Forward P/E Ratio
Bullish Counterpoint #2: Valuations Are Not Overly Demanding after Excluding Mega Cap Technology
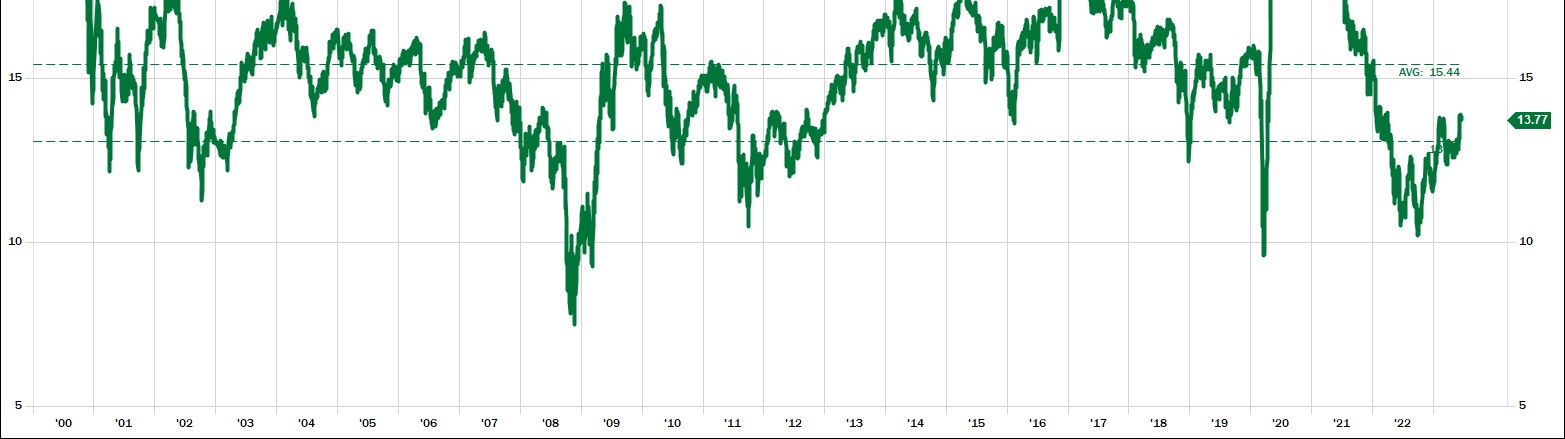
Whether we reorganize the S&P 500 to the equal weighted S&P 500, or the S&P 500 ex Tech or even the S&P 490 (excluding the ten largest stocks), we would reach the same conclusion that valuations excluding mega cap tech are roughly in line with longer term historical averages at around 15.5x – 17x forward earnings. This dynamic is even more pronounced if we shift our focus to US Mid Cap, US Small Cap, or Intentional Developed equity markets, which are all trading cheap to their own long term historical averages. Regardless of the next 10% + move in equity markets, historically investors have been rewarded with 5 – 10 year forward returns when putting capital to work around these valuations in US Mid Cap, US Small Cap, and International Developed equities.
In addition, there is plenty of legitimacy to the viewpoint that the best secular growth business in the history of corporate America deserves a premium valuation (maybe the “Magnificent 7” aren’t overpriced given their monopolistic characteristics?). And this is only accentuated by the fact that their balance sheets are nearly bulletproof, and these same businesses could be the best positioned to capitalize on the potentially massive AI theme (what does AI do to their future earnings power?).
S&P 600 Small Cap Forward P/E Ratio
Bearish Viewpoint #3: The US Stock Market Has Become Increasingly Narrow
At the end of May, the S&P 500 was up 9.5% year to date. According to Chris Verrone and Strategas Research Partners, the top 10 market cap weighted names had accounted for 104.1% of the total S&P 500 gains, which was the highest contribution by the top ten names ever, on a calendar year basis going back to 1990. Said another way, ten stocks carried the market 10% higher all by themselves, in the two-and-a-half-month period following the SVB failure. On top of this, outside of the blowout earnings guidance from Nvidia, nearly all of this rally was attributable to multiple expansion, which of course isn’t sustainable over longer time frames.
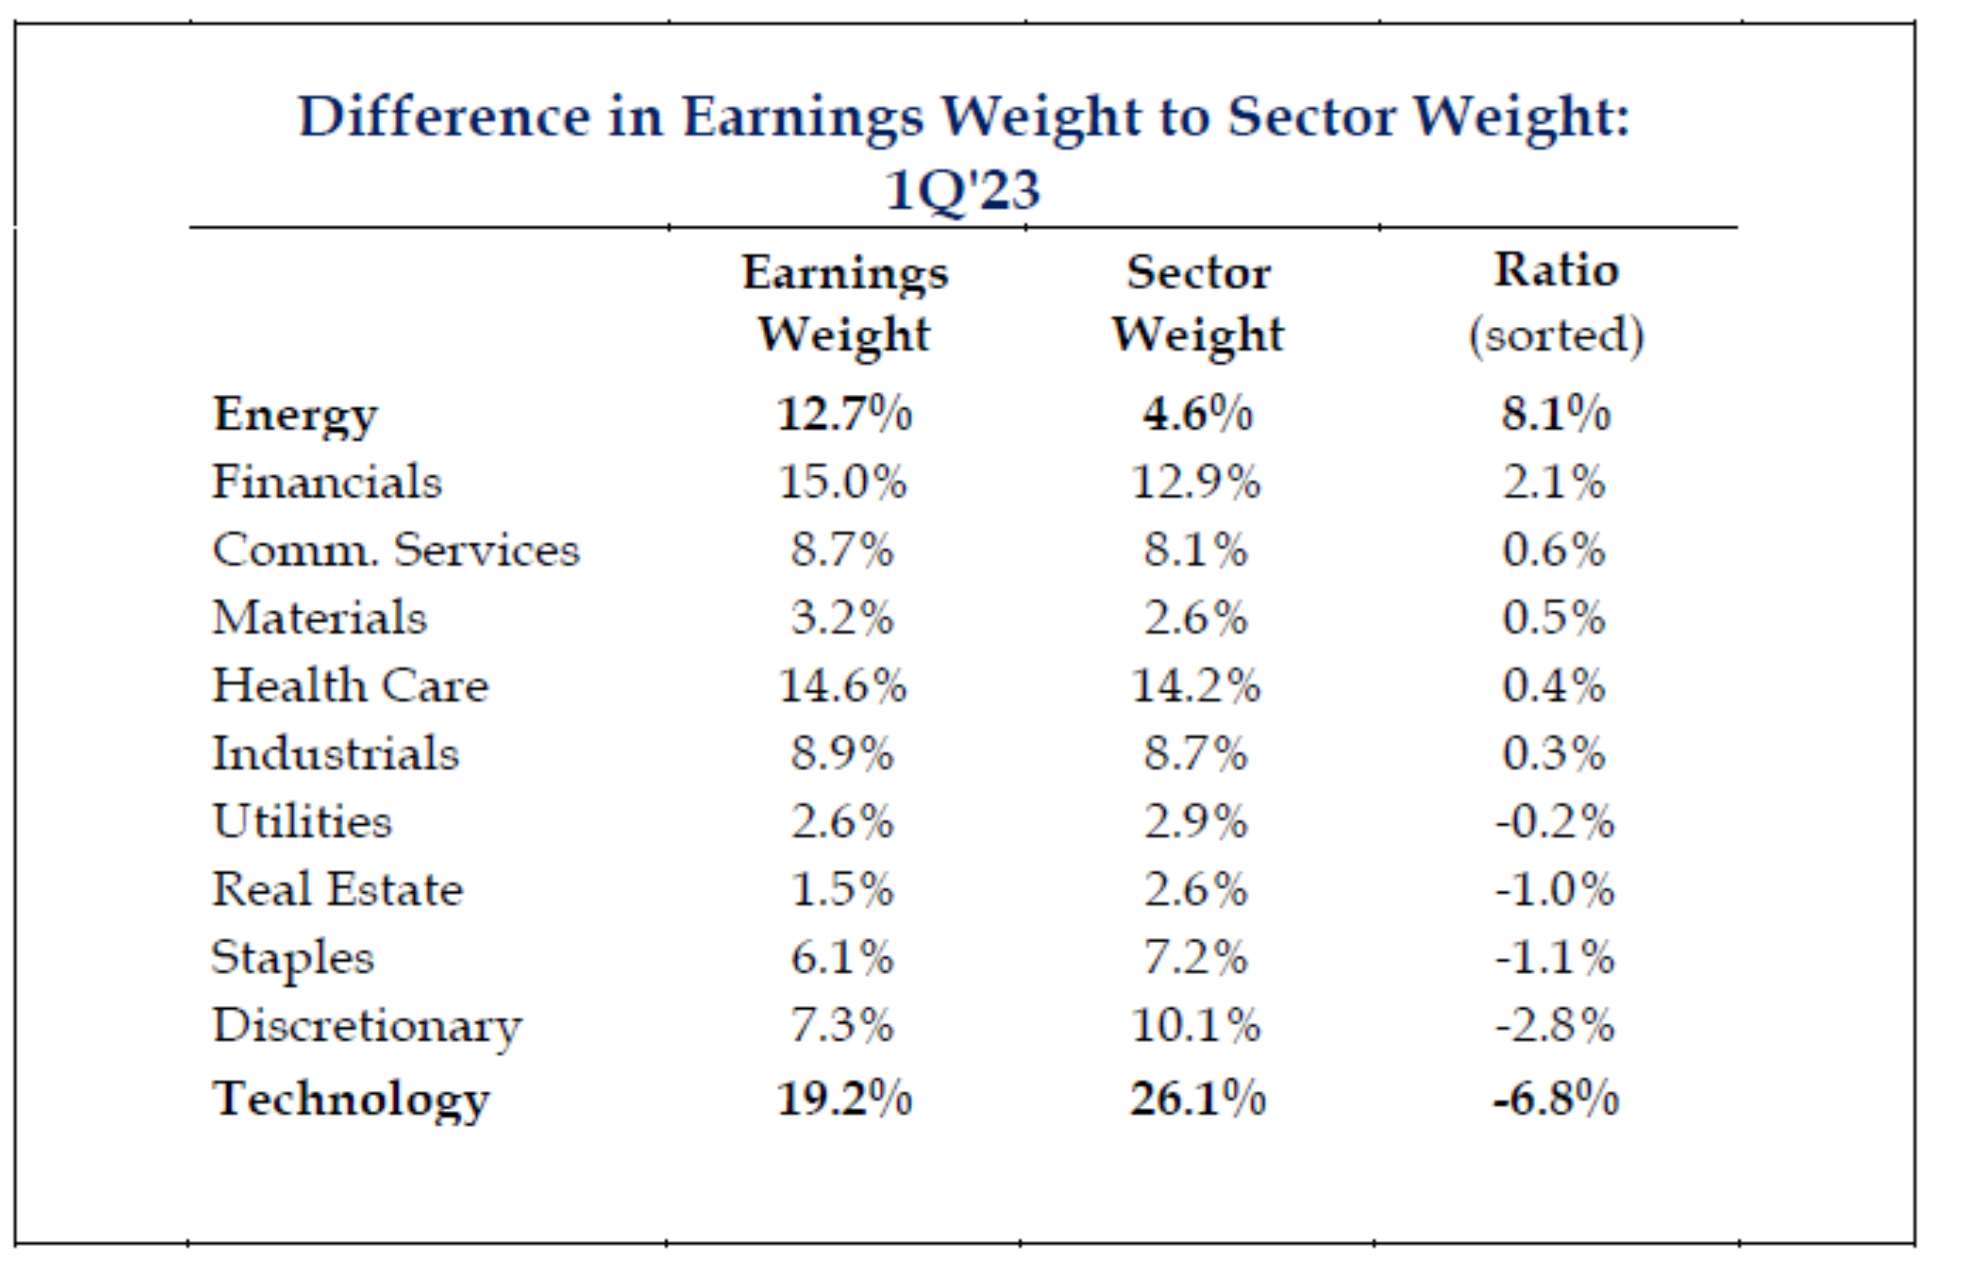
Bob Farrell, the famed Merrill Lynch strategist, taught us that markets are strongest when they are broad and weakest when they narrow to a handful of blue-chip names (i.e. 2007, 2021, etc.). Currently, we are back to a spot where the Technology and Consumer Discretionary sectors have outsized weightings in the S&P 500 Index relative to their earnings contribution (the market is betting they will “grow” into this). We witnessed a similar dynamic with technology stocks in 2000 and to a lesser degree financials in 2008.
Bullish Counterpoint #3: Technicals for US Stocks Are Strong and Improving
The S&P 500 held its 200 week (almost 4 year) moving average during the 2022 bear market and is now trading well above its upward sloping 200 week moving average. Trading above an upward sloping 200 week moving average coupled with defending this moving average during a meaningful test of it (twice in 2022) is evidence that US equity markets remain in a secular bull market (which began in either 2009 or 2013 depending on who you ask) according to many market technicians.
In addition, the S&P 500 experienced a Golden Cross (where the 50-day moving average crossed above the 200 day moving average) at the end of January 2023. The S&P 500 is currently trading above its upward sloping 200 day moving average, which can be viewed as a signal that we are in a cyclical bull market as well. Furthermore, global equity markets have been anything but narrow for the past month, as a wide variety of stocks / sectors / styles, etc. (cyclicals, small caps, etc.) have posted respectable gains in June. Breadth tends to lead prices, and we could be getting closer to having confirmation that this rally is broadening out.
Ryan Detrick of the Carson Group pointed out numerous constructive indicators recently which give further support to the bullish narrative.
- The S&P 500 made no new 52-week highs from 1/3/22 until 6/12/23. Since 1950, there have been 15 other instances when the S&P 500 did not make new 52-week highs for at least one year. Once a new 52 week high occurred, the S&P 500 was higher one year later 15 out of 15 times with average gains of 17.4% and median gains of 14% (Source: Ryan Detrick & Carson Group).
- The S&P 500 is more than 8 months past its (bear market) 52-week lows. When a bear market is not complete, it usually resumes lower within a time frame that is less than 8 months. Once the S&P 500 has gone 8 months without making a new 52-week low, the S&P 500 is higher one year later 80% of the time since 1950 (Source: Ryan Detrick & Carson Group).
- The S&P 500 is more than 20% above its October 2022 lows. After the S&P 500 has gained 20% from a Bear Market Low (when stocks declined by more than 20%), it usually signals that more gains are ahead. Since 1950, the S&P 500 has been higher 92% of the time a year after a new bull market has officially begun, by an average of 17% (Source: Ryan Detrick & Carson Group).
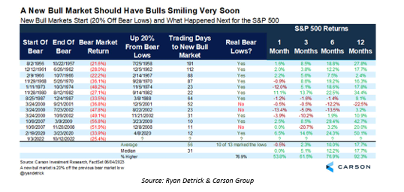
Although a 20% gain over 8 months is a weak rally compared to other historical advances marking the beginning of a new bull market, the combination of a 20% gain and a relatively long-time frame (8 months) favors the bulls even more as most other bear market rallies in excess of 20% happened over the course of a couple of months and resumed lower again in a relatively quick manner.
Bearish Viewpoint #4: After Unexpectedly Expanding in the First Half of 2023, Liquidity is Set to Contract During the Back Half of This Year
Post 2008, the correlation between the S&P 500 and the Federal Reserve balance sheet is nothing short of amazing and / or shocking. They have basically moved in lock step with one another for most of the last 15 years.
S&P 500 (green) vs. Fed Balance Sheet (blue)
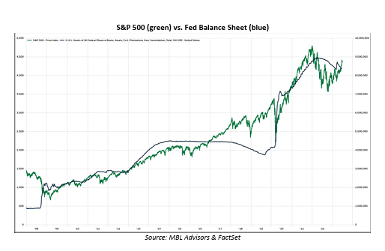
The Fed has been conducting quantitative tightening (QT) (shrinking their balance sheet) as a part of their more restrictive monetary policy stance for the last year. This comes after the Fed made a habit of expanding their balance sheet (QE) when they wanted to further ease financial conditions at various times over the last 15 years but were restricted by more traditional methods since short term interest rates were already at 0%. Despite the Feds ongoing QT program, the Fed’s policy response to the regional banking crisis in March caused the Fed’s balance sheet to expand once again and unwound several months of QT in a couple of weeks.
Congruent with the Fed’s emergency lending program to help give some relief to bank balance sheets, the U.S. government was spending down the Treasury General Account (TGA) (essentially the government’s operating account) as debt ceiling limitations prevented them from borrowing (issuing more debt) additional funds. This served as an even larger injection of liquidity into the financial system than the Fed’s emergency lending facility, and the combination of these two programs helped to massively ease financial conditions during the first half of 2023 (unexpected tailwind for stocks).
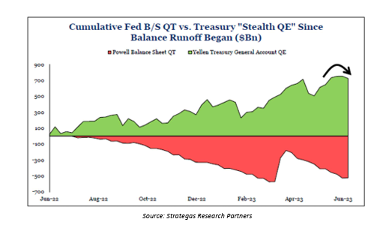
Now that the debt ceiling has been raised, the government will go back to borrowing money (instead of spending “savings”) in order to facilitate their deficits, which will drain liquidity from the economy as the Fed is no longer funding the government’s deficits through their QE programs. Further, the TGA will need to be restocked, and all of this will occur as QT continues on its planned path. Thus, “net liquidity” to the financial system is going to shift from a tail wind in Q2 to a head wind in Q3 and beyond. We will see how equity markets handle this dynamic, but investors don’t have to extrapolate too far to believe that markets may struggle, given how positively risk assets have reacted to liquidity injections (100% of the time) over the past 15 years.
We want to emphasize the fact that the full “bite” from tighter monetary policy probably has not been felt yet. Central bankers constantly remind us that monetary policy “acts with long and variable lags.” The vast majority of rate hikes are less than one year old, and the Fed seems to be increasingly tied to their “higher for longer” policy stance. This would hold the Federal Funds Rate at a level which is substantially higher than trend growth rates for the US economy, which doesn’t seem sustainable to us. “Higher for longer” interest rates coupled with QT and TGA restocking seems like an underappreciated risk to us.
Bullish Counterpoint #4: It’s Not Just Liquidity;
Several Factors Are Moving in the “Right” Direction for the Bulls
First and foremost, headline inflation has declined for 11 months in a row. Even though the precise bottom for most equity indices occurred in October of last year, the October lows barley undercut the June 2022 lows and many individual stocks actually bottomed in June of last year. Coincidentally or not, June of last year was also when inflation (CPI) peaked at 9.1%. Year-over-year inflation could be below 3% when we receive the June 2023 inflation data in mid-July (although this will very likely be the low CPI print for the remainder of 2023).
Next, earnings have been much “better than feared” so far this year, and 2023 & 2024 earnings estimates have stabilized and begun to tick higher over the past couple of months. This is even more pronounced when looking at S&P 500 earnings ex-Energy – helping to isolate the fact that oil has been down big over the last year. Savita Subramanian and BofA Global Research recently upgraded their 2023 S&P 500 earnings forecast to $215, from their previous estimate of $200 per share. Savita and her team also see additional earnings growth in 2024, estimating S&P 500 earnings per share to come in around $235. If the trough in corporate earnings for this cycle comes to fruition in Q2 / Q3 2023, then equity markets bottoming out in October 2022 will line up perfectly with history, as the S&P 500 usually puts its lows in place roughly a year ahead of earnings on average.
Third, the Mediterranean restaurant CAVA had its IPO on June 15, 2023. CAVA’s stock (which has nothing to do with AI!) went up over 100% that day and has held onto its gains since then. This comes after the IPO market spent the better part of the last two years in a draught. Although this is a relatively small anecdote, IPO’s usually don’t even come to market during bear markets (2022) let alone go up 100% on their first day of trading.
There are plenty of other signs of “bull market” price action as well. Defensive sectors are the worst performing sectors year to date (after posting some of the best relative performance last year). A more granular way to observe cyclical vs. defensive leadership is to view consumer discretionary stocks vs. consumer staples stocks (which gave a great warning signal in late 2021 / 2022). Currently, consumer discretionary stocks are exhibiting strong relative strength vs. consumer staples, confirming the ascent in global equity markets year to date. The same thing is happening with Industrials (very cyclical) vs. the equally weighted S&P 500. At some point, investors need to respect the collective wisdom of the market, regardless of the “macro” narrative.
In addition, we mentioned in our December 2022 ISO that stocks would likely move higher if the VIX traded lower than its average in 2022. So far, this has played out to an even larger degree than even the most bullish investors could have expected with the VIX trading as low as 12 recently (it never got this low in 2020 / 2021) versus an average reading of 25 in 2022.
Conclusion
When the “crosswinds” are this strong it becomes more difficult for investors to formulate high conviction conclusions while also maintaining their humility and discipline within their investment process. The economic and earnings data clearly leaves a lot to be desired. At the same time, the “bear thesis” is relatively stale, as the much-feared economic recession and ensuing earnings decline has yet to take place while the Fed and inflation have become relatively “known” factors, at least on the surface (we seem to be past large surprises around inflation and the Fed should be very close to finished with their interest rate hikes).
We firmly believe that the collective knowledge of the markets is usually more astute than any individual investor, but the exception to this rule is around big turning points in markets. The bulls couldn’t ask for too much more from the internal signals that US equity markets are currently generating. At the same time, the current rally will either mark the weakest start ever to the beginning of a new bull market or one of the longest and strongest bear market rallies of all time.
Increasing risk at 19x forward earnings on the S&P 500 has not been overly rewarding to investors traditionally. Nonetheless, markets always look more expensive than they actually are just before earnings reaccelerate, and this dynamic will only be accentuated if (and this is a BIG “if) we are on the verge of a new CAPEX cycle driven by AI on reshoring of manufacturing.
When we reflect upon our December 2022 ISO, we are surprised by how many of the ideas we outlined have been at least directionally correct. Having said this, there has been one investment theme which has trumped all others so far in 2023, and that has been the massive outperformance of mega cap technology related stocks vs. everything else. This has surprised us to some degree as we continue to see the case for a shift to secular leadership from “inflation assets” rather than the “deflation assets” which dominated the 2010’s during the QE era. At the same time, we also believe that the end of the QE era will place an increased importance on emphasizing fundamentals, as the cost of capital has normalized, and in this regard, investors might continue to be rewarded by sticking with mega cap technology stocks (valuations aside).
Markets never presented investors with the “fat pitch” that everyone seemed to be waiting for, and this has left many allocators of capital “frustrated” with the current market dynamics. Observing global equity markets this year has left us wondering if markets have become increasingly efficient at discounting the future state of the corporate landscape, including investors being willing to look out further into the future than they traditionally were willing to in the past.
In light of all of this, we continue to feel good about our portfolio construction, which is positioned to (i) meaningfully participating during broad based equity bull markets, while minimizing single stock risks; (ii) have roughly ¾ of our equity exposure directly hedged against downside risks in equity markets; (iii) emphasize yield from high quality securities in both equities and fixed income which will allow portfolios to continue to slowly compound gains over time, including in broad range bound markets which we have experienced on numerous occasions throughout history; and(iv) continuing to modestly extend duration within fixed income portfolios as interest rates move higher as we continue to believe that high quality bonds will act as a good stabilizer to portfolios if equity markets experience any significant downside movement.
In summary, we continue to believe our portfolios are constructed to emphasize our discipline of “taking what the market gives us” within the construct of our long-term investment plan. We are extremely grateful for the trust that you place in our team at MBL Advisors, and we look forward to discussing these topics with you in more detail sometime this summer.
Sincerely,
Brian Gift, CFA
Chief Investment Officer
MBL Advisors
Bob Farrell’s 10 Investing Rules
Bob Farrell is a legendary Merrill Lynch strategist who published his timeless list of 10 investing rules several decades ago, a version of which can be found here https://www.investopedia.com/articles/fundamental-analysis/09/market-investor-axioms.asp.
It seemed some investors believed these rules were no longer as relevant as they once were when they didn’t hold true to form during the extremely abnormal bear market and subsequent recovery in 2020 and 2021. However, all of these rules seem especially pertinent today as we proceed thorough a more traditional market environment where the 800 pound gorilla (the Fed) is no longer the overriding factor. We have written about Bob Farrell’s rules on multiple occasions in the past. But their timelessness and truth always amaze us each time we observe them.
- Rule #1. Markets tend to return to the mean over time.
- Rule #2. Excesses in one direction will lead to opposite excesses in the other direction.
- Rule #3. There are not new eras – excesses are never permanent.
- Rule #4. Exponential rapidly rising or falling markets usually go further than you think, but they do not correct by going sideways.
- Rule #5. The public buys the most at the top and the least at the bottom.
- Rule #6. Fear and greed are stronger than long-term resolve.
- Rule #7. Markets are strongest when they are broad and weakest when they narrow to a handful of blue-chip names.
- Rule #8. Bear markets have three stages – sharp down, reflexive rebound and a drawn out fundamental downtrend.
- Rule #9. When all of the experts and forecasts agree – something else is going to happen.
- Rule #10. Bull markets are more fun than bear markets.
Disclosures:
This report was prepared by MBL Wealth, LLC, and reflects the current opinion of the firm, which may change without further notice. This report is for informational purposes only and is not intended to replace the advice of a qualified professional. Nothing contained herein should be considered as investment advice or a recommendation or solicitation for the purchase or sale of any security or other investment. Opinions contained herein should not be interpreted as a forecast of future events or a guarantee of future results. Different types of investments involve varying degrees of risk, and there can be no assurance that any specific investment will either be suitable or profitable for a client’s portfolio. Economic factors, market conditions, and investment strategies will affect the performance of any portfolio and there are no assurances that it will match or outperform any particular benchmark. Commentary regarding the returns for investment indices and categories do not reflect the performance of MBL Wealth, LLC, or its clients. Historical performance results for investment indices and/or categories generally do not reflect the deduction of transaction and/or custodial charges or the deduction of an investment-management fee, the incurrence of which would have the effect of decreasing historical performance results. Investors cannot invest directly in an index. The indices referenced herein have been selected because they are well known, easily recognized by investors, and reflect those indices that the Investment Manager believes, in part based on industry practice, provide a suitable benchmark against which to evaluate the investment or broader market described herein. Although certain information has been obtained from sources believed to be reliable, we do not guarantee its accuracy, completeness or fairness. We have relied upon and assumed without independent verification, the accuracy and completeness of all information available from public sources. This material is provided for informational purposes only. It is not an offer or solicitation to buy or sell any securities. Past performance does not guarantee future results, which may vary. The value of investments and the income derived from investments will fluctuate and can go down as well as up. A loss of principal may occur.
Investment Advisory Services are offered through MBL Wealth, LLC, a Registered Investment Advisor. Securities are offered through M Holdings Securities, Inc., a registered broker/dealer, member FINRA/SIPC. MBL Advisors Inc. is independently owned and operated. #4550659
This material and the opinions voiced are for general information only and are not intended to provide specific advice or recommendations for any individual or entity. To determine what is appropriate for you, please contact your personal advisors. Information obtained from third-party sources are believed to be reliable but not guaranteed. The tax and legal references attached herein are designed to provide accurate and authoritative information with regard to the subject matter covered and are provided with the understanding that MBL Advisors Inc., is not engaged in rendering tax, legal, or actuarial services. If tax, legal, or actuarial advice is required, you should consult your accountant, attorney, or actuary. MBL Advisors Inc., does not replace those advisors. The use of trusts involves a complex web of tax rules and regulations. You should consider the counsel of an experienced estate planning professional before implementing such strategies.
MBL Advisors Inc. is independently owned and operated. Investment Advisory Services are offered through MBL Wealth, LLC, a Registered Investment Advisor. For important information related to MBL Wealth, LLC, refer to the Client Relationship Summary (Form CRS) by navigating to http://mbl-advisors.com. Securities are offered through M Holdings Securities, Inc., a registered broker/dealer, member FINRA/SIPC. For important information related to M Holdings Securities, Inc, refer to the Client Relationship Summary (Form CRS) by navigating to https://mfin.com/m-securities. Insurance solutions are offered through MBL Advisors Inc.