

Brian Gift, CFA — Chief Investment Officer — 704-335-4518
Capital markets seem to have become increasingly dynamic as the pace of innovation has compounded around the world, which in turn has given investors an endless list of variables to consider when constructing portfolios.
In this Investment Strategy Outlook, we will elaborate on various topics including investor sentiment, elevated valuations, diversification versus concentration within portfolios, inflation, interest rates, Trump, and AI.
In the end, we believe many of these factors will lead to the continuation of higher levels of nominal growth, interest rates and an ensuing extension of the profit cycle for corporate America. There will surely be plenty of surprises unanticipated by the countless 2025 “Year Ahead” outlooks written over the last couple of months. However, it seems that policy makers will be an obvious source of volatility (in both directions) for all asset classes in the year ahead.
Risk assets have demonstrated unease with 10-year bond yields above 4.5% +/- on numerous occasions over the last couple of years. A couple of large Wall Street Investment houses are putting 40% odds on the Fed having to reverse course and hike rates in 2025 (we disagree, but who knows for sure). America is far more sensitive to higher prices than we were prior to COVID, which in turn means that the bond market will demand that the Fed continues to thread the proverbial needle in balancing their dual mandate. Similarly, Trump was anything but a fiscal hawk during his first term as President, and 6% +/- budget deficits will likely not be tolerated by the markets indefinitely.
The bottom line is that the bond market will continue to have a significant influence on how most asset classes behave. Like many investors, we are rooting for a broadening of both fundamentals and performance beyond Mega Cap tech (“US exceptionalism”). We are optimistic that conditions are in place to support this narrative in the years ahead.
Investors are far more enthusiastic entering 2025 than they were to start 2023 or 2024, which seems to be well justified in many regards as economic data continue to track at a respectable level (Atlanta Fed GDPNow tracking at 2.3% for Q4 2024), the unemployment rate continues to hold steady near multi decade lows, credit spreads remain pinned to their cycle lows, and most importantly, earnings growth is forecasted to be robust for the foreseeable future.
The majority of Wall Street strategists have set their S&P 500 price targets to forecast gains in the 10% – 15% range for 2025. This is a notable shift from 2023, when the average strategist price target projected a negative year (the only time this has happened since 1999. Source: Bloomberg). At the beginning of 2024, the outlook among strategists wasn’t much more bullish, as the average price target was only 2% – 3% above where the year began.
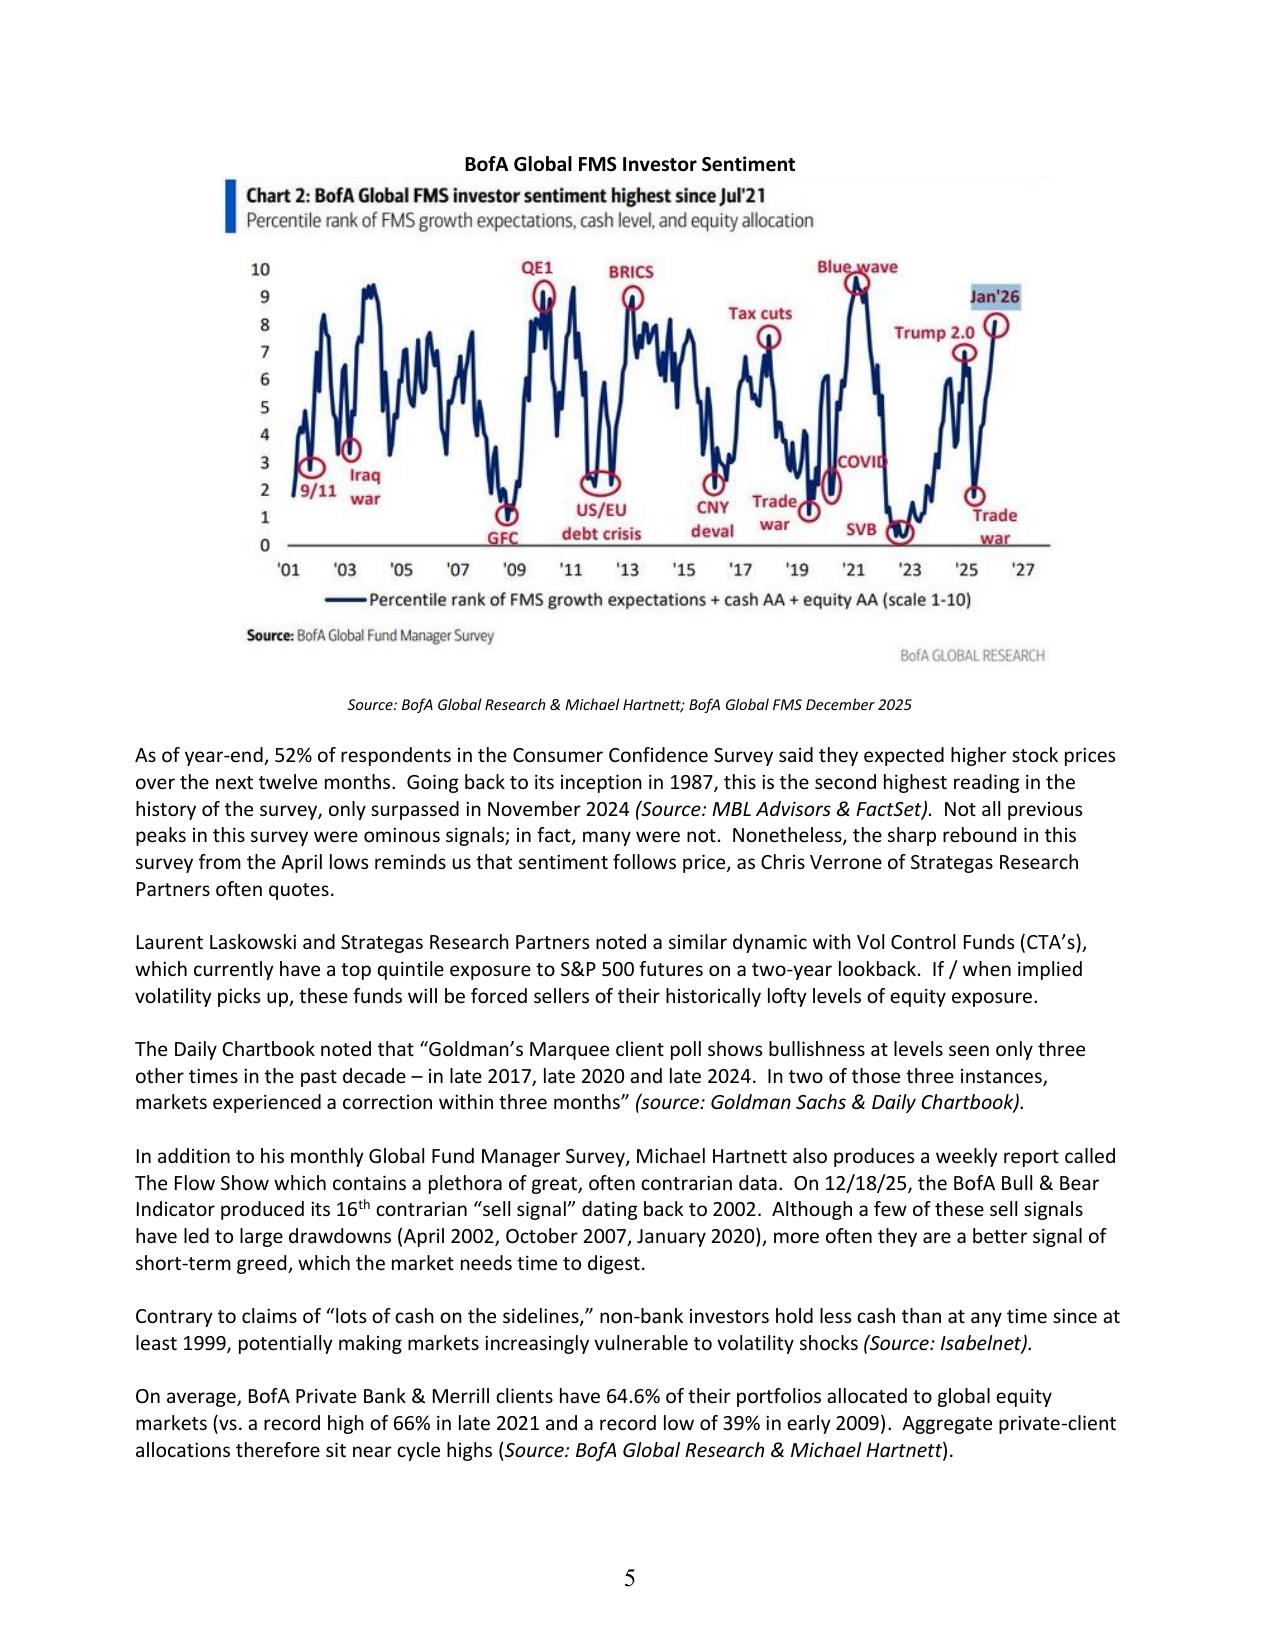
The Bank of America Global Fund Manager Survey is often a good indicator of how the consensus is positioned. In December 2024, the Fund Manager Survey showed a record overweight to US equities in the history of this survey going back to 1999. This is in comparison to March 2023 (SVB Bank failure), when investors were holding their largest underweight to US equities since prior to 2008.
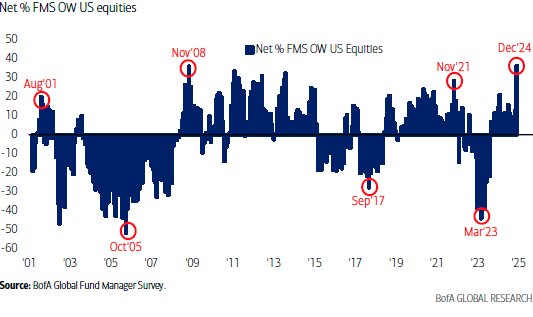
Source: BofA Global Research
The December Fund Manager Survey also revealed a similar dynamic with broad equity positioning relative to cash. Today, equity positioning is near its previous peaks relative to cash. It’s worth noting that the inverse was true in September 2022, precisely when the previous bear market ended, and investors held an all-time underweight to stocks vs. cash.
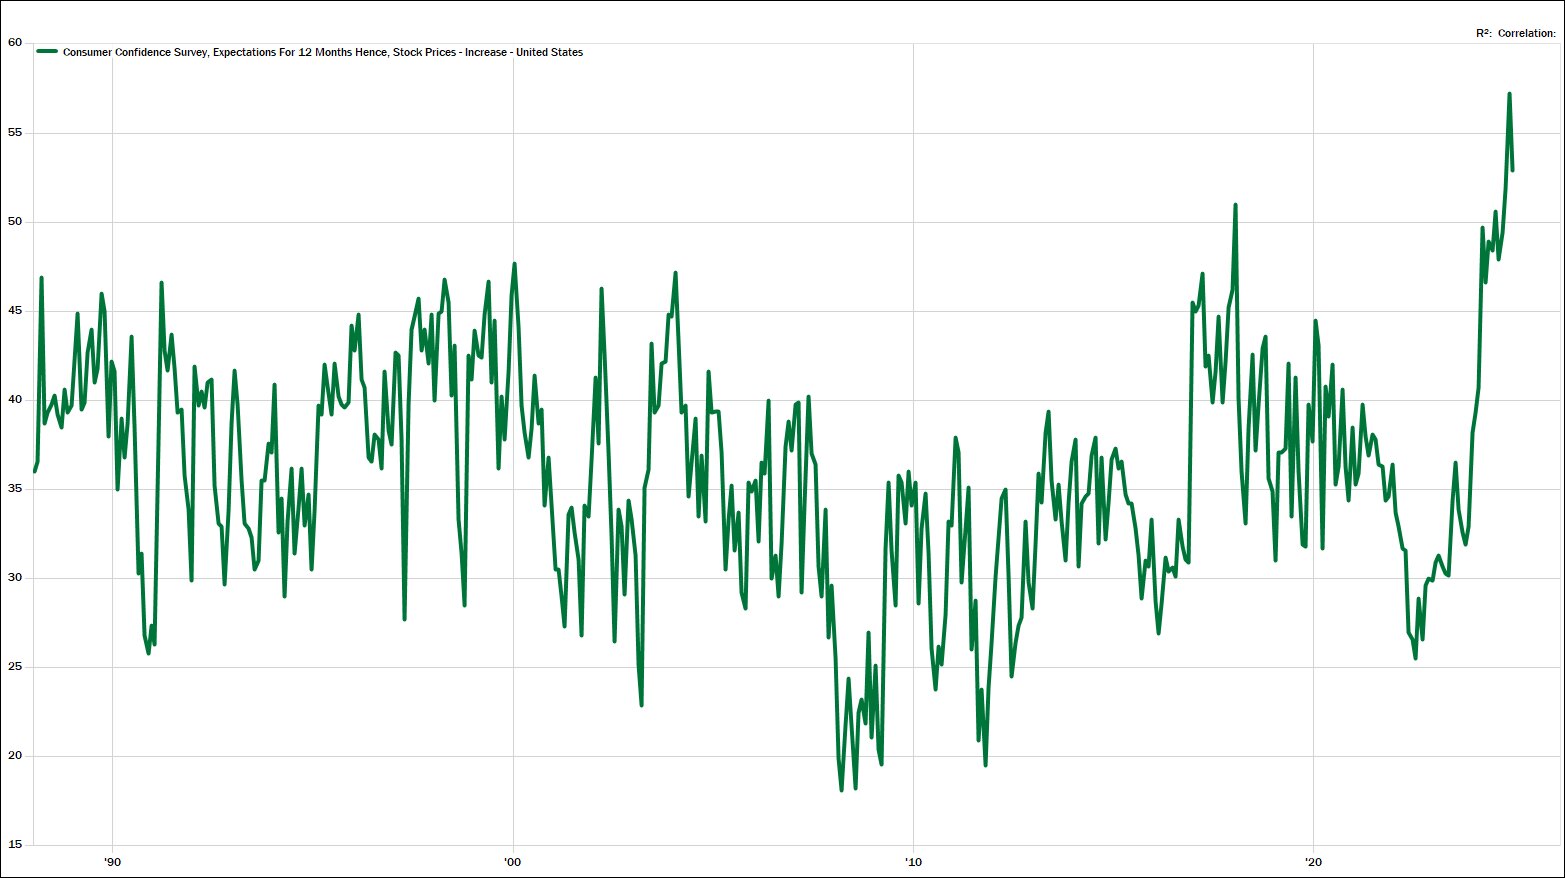
Myriad additional data points corroborate this same message. A few others of note are:
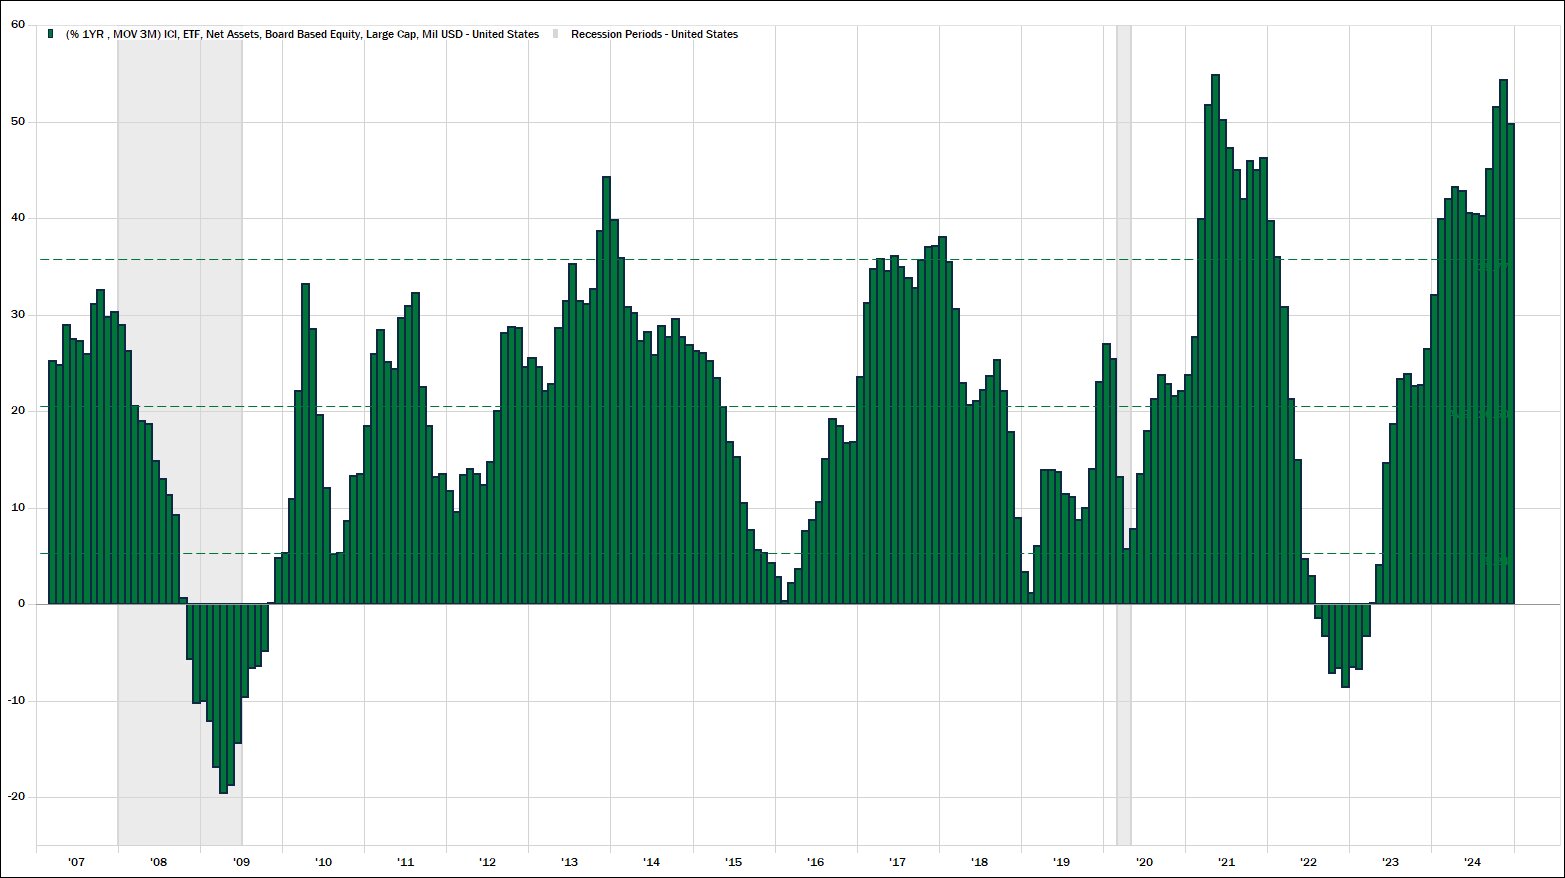
Source: MBL Advisors & FactSet
Source: MBL Advisors & FactSet
Much of this is the natural course of evolution during a bull market. In isolation, none of these data points tend to signal the end of a bull market. But they could offer a clue suggesting that investors may need to wrestle with their own (lofty) expectations at some point in the year to come.
Economic weakness and an ensuing recession are no longer perceived as the primary danger to asset prices by most investors, contrary to a large swath of the past three years. Goldman Sachs recently noted: “80% of our clients expect US GDP to grow above 2% this year and no one anticipates a recession, with only 1% of clients expecting US GDP growth below 1%. This is in stark contrast to 2024 and 2023, when 27% and 57% of people, respectively, expected a recession” (source: @zerohedge).
Even David Rosenberg, the famed market bear, and incredibly astute research analyst, issued an apology to investors last December in his note titled “Lament of a Bear” (source: @EconguyRosie). This followed some of his less than optimistic counterparts losing their jobs earlier in the year (Chief Strategists at JP Morgan & Morgan Stanley).
Despite the bears on Wall Street becoming an increasingly rare breed, the media is eager to remind us of the plethora of potential worries: tariffs, inflation, weak growth outside of the US, higher interest rates, a strong USD, fiscal excesses, a Fed policy error, other things that go bump in the night. But investors are often well served in remembering that bull markets usually climb the proverbial “wall of worry.” Markets often get into trouble when signs of discomfort have largely disappeared (2018, 2021, etc.).
When putting macro / headline risks to the side for a moment, we do believe that there are two hazards which are potentially underappreciated by investors today. First, nearly all fundamental valuation metrics are registering in the 90th to 99th percentile of historical data (2009 was the exact opposite). And second, index concentration has reached multi-decade highs for the S&P 500. This is not to say that there is a shortage of attention on either of these issues, but some investors seem to expect these trends to continue almost indefinitely.
Last October, Goldman Sachs, Apollo and Bank of America Global Research simultaneously noted that they expect the S&P 500 to compound at roughly 3% per year for the next several years (+/- a few % on either side). More recently, Morningstar has joined this crowd. Apollo is relatively more bullish compared to the others, as their 3% return forecast “only” lasts for three years. Bank of America Global Research and Goldman Sachs projected 3%+/- returns for the next decade, given where starting valuations are today.
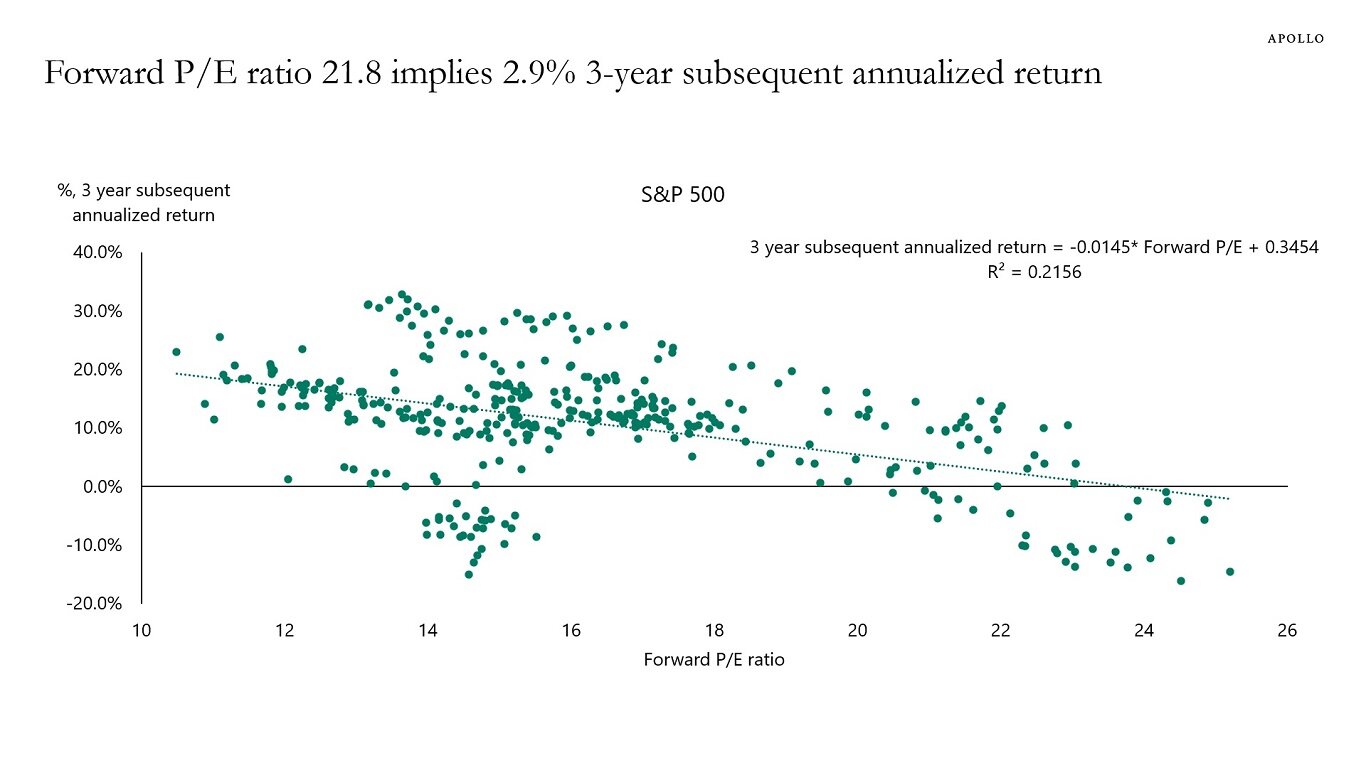
Source: Apollo & Torsten Slok
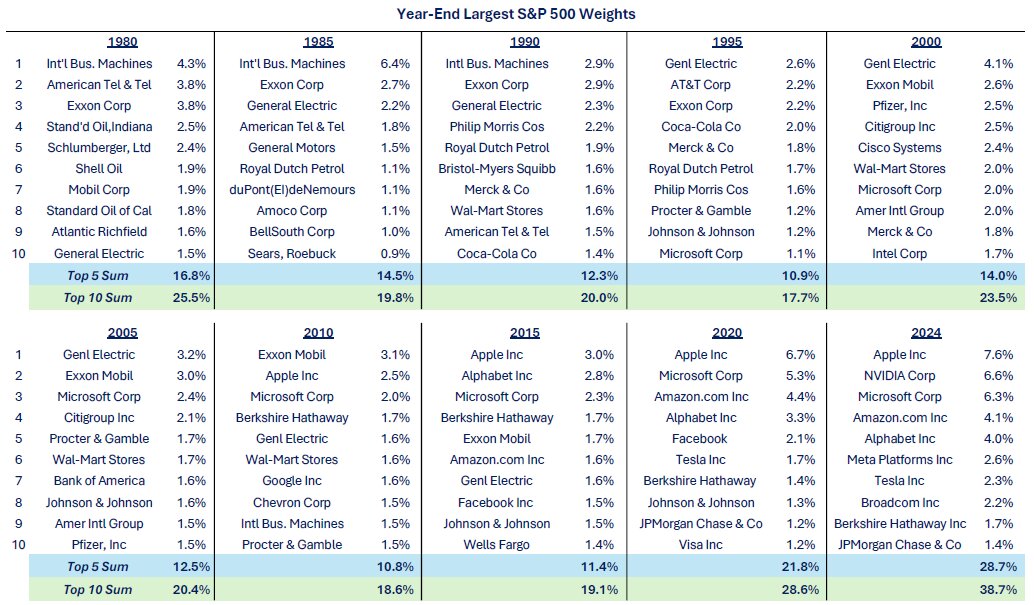
The historically elevated valuations in US Large Cap equity indices are directly tied to the increased concentration within these indices themselves. The largest 10 stocks are some of the most expensive stocks in the market from a fundamental standpoint and now make up 39% of the S&P 500. The top five names account for 29% of the index. We haven’t seen these levels of concentration within the S&P 500 in nearly 70 years. For most of the last 40 years the top 10 stocks constituted roughly 20% +/- of the index, while the top five names made up 11% – 15% of the S&P 500. Thus, the concentration of the top five and top 10 names in the index has effectively doubled relative to most of the last 50 plus years.
This has served investors well for the last decade as the largest names have also been the best performing names during this time. This has made the S&P 500 virtually an unbeatable index for investors who have higher levels of diversification within their portfolios.
The cap weighted S&P 500 roughly doubled the performance of the equal weighted S&P 500 in 2023 and again in 2024. The reason for this can be simply explained in the fact that the largest 10 names accounted for 68% of the index’s total performance in each of the last two years (source: Strategas Research Partners). Carter Braxton Worth of Worth Charting noted that “2024 was a not so spectacular year for US equities. The Russell 3000 (98% of the investible US Equity Market) was +22%, yes, but the median performance of the Index’s constituents was 3.82%. 1331 stocks in the index were DOWN (45.7%). Sobering” (source: @CarterBWorth).
It is important to note that valuations are a terrible timing tool and offer no predictive power over shorter time frames. This is especially true when animal spirits are running hot as they seem to be today. However, the simple average trailing twelve-month PE ratio (i.e. based on 2024 EPS) for the 10 largest stocks in the S&P 500 currently stands at 46x (source: MBL Advisors & FactSet 1/30/25).
Source: Todd Sohn, CMT & Strategas Research Partners
Aside from the early 1970’s, the late 1990’s and the 2020’s, the equal weighted S&P 500 has outperformed the capitalization weighted S&P 500 throughout most intermediate to longer term time periods over the last several decades. One big question for investors is whether the dominance of the largest stocks in the market is the “new normal” or if dramatic mean reversion lies ahead? Eventually, we believe the beneficiaries of AI will expand well beyond the Mag 7, and this will serve as a catalyst for some mean reversion in market performance.
Savita Subramanian and Bank of America Global Research are firmly in the mean reversion camp as their 10-year forecast is far more bullish for the equal weighted S&P 500. Savita believes that the equal weighted S&P 500 could compound at roughly 8% +/- per year for the next decade if dividend payout ratios mean revert higher back to their long-term averages. Richard Bernstein of RBA Advisors was Savita’s mentor at Merrill Lynch a few decades ago, and he also shares a similar opinion.
We believe that the increasingly popular analogies to the tech bubble are a poor comparison to the current market environment. The best performing stocks of the last few years are some of the highest quality businesses in the history of corporate America, which is much different than the TMT bubble. However, the Nifty Fifty environment from the 1970’s may offer some parallels, when investors bid up the largest stocks in the market to unsustainable valuations and considered most other businesses not to be worthy of their capital.
Ed Yardeni (Yardeni Research) and Tom Lee (FSInsights) continue to be two of the most optimistic strategists on Wall Street. They also happen to be two of the most accurate strategists of whom we are aware, over the last 15 years. Yardeni believes the S&P 500 will finish this decade around 10,000 as earnings for the index will be roughly $400 per share. If 2025 and 2026 earnings stay on track with current estimates, Yardeni’s earnings forecast could become increasingly consensus as time passes.
Tom Lee (FSInsights) has published some even more bullish scenarios than Yardeni. Lee believes that meaningful bear markets often coincide with generations moving beyond peak spending years (28-48 years old). Millennials have another decade plus of peak spending ahead of them, which Tom believes is a positive catalyst for US equities, all else equal.
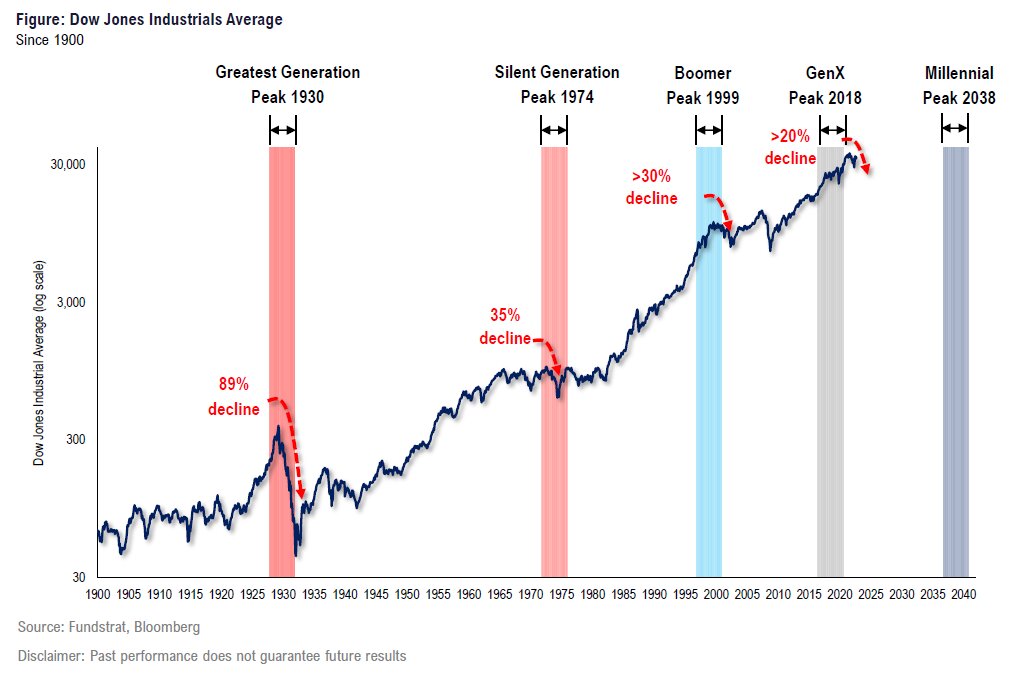
Source: FSInsights & Tom Lee
Both of these strategists believe we are in the middle of a technology driven productivity boom. And if this continues, historically high corporate operating margins will hold steady, and therefore support earnings in the years to come. In their opinion, more profitable businesses which also exhibit secular growth characteristics (Mega Cap Tech) are largely deserving of elevated valuations relative to historical “norms.”
In his 2025 technical outlook, Stephen Suttmeier from BofA Global Research published the following:
“In 2025 the SPX will enter the 12th year of its secular bull market. The secular bull markets from 1950 – 1966 and 1980 – 2000 lasted 16 and 20 years respectively, which means the current secular bull market is mid to late cycle and can extend until 2029 to 2033… The SPX looks overextended on its move to 6000 in late 2024. This roadmap chart shows SPX achieving 6000 in mid-2026, not late 2024 and suggests that 2025 could see downward mean reversion.”
Regardless of how 2025 plays out, it should be noted that comparison to these previous secular bull market roadmaps project meaningful upside for the S&P 500 before this secular bull market is finished.
Brian Belski, the Chief Investment Strategist at BMO Capital Markets, believes we are returning to a “normal” environment for both the economy and capital markets alike. His definition of “normal” refers to the investment environment prior to 2008. The post GFC environment has been abnormal in many regards, as central banks and governments around the world have become fond of enacting various measures of fiscal and monetary policy which are unconventional and extreme by historical standards. Jason Trennert of Strategas Research Partners recently wrote “Reversion to the mean, at least until the introduction of extraordinary monetary policy, had been one of the most reliable concepts in finance, if not life itself.”
The most important asset price in the world, the US 10 Year Treasury Bond has certainly normalized to a large degree. 10-year bond yields approaching 5% seem high to many investors relative to fifteen years of artificially low rates. But going back to 1950, the average yield on the 10 Year Treasury is 5.62% and the median yield on the 10 Year Treasury bond is 4.96% (source: MBL Advisors & FactSet).
Despite conventional thinking, higher bond yields are not necessarily a bad thing, if they are associated with stronger economic growth. Real GDP was below 2% for the entire period between 2008 and COVID. For the last few years, the US economy has surprised to the upside with 2% – 3% Real GDP growth, thanks to higher levels of productivity (and government spending), coupled with 5% – 6%+ nominal GDP growth. These levels of growth were declared a thing of the past by many economists during the post-GFC era.
Higher levels of nominal GDP are favorable for corporate profitability since revenues grow in nominal terms. In this regard, Belski believes that companies can grow earnings, across a plethora of industries and market caps, by upper single digits rates in the years to come. He also believes that US equity markets should compound at a similar rate over the next three to five years.
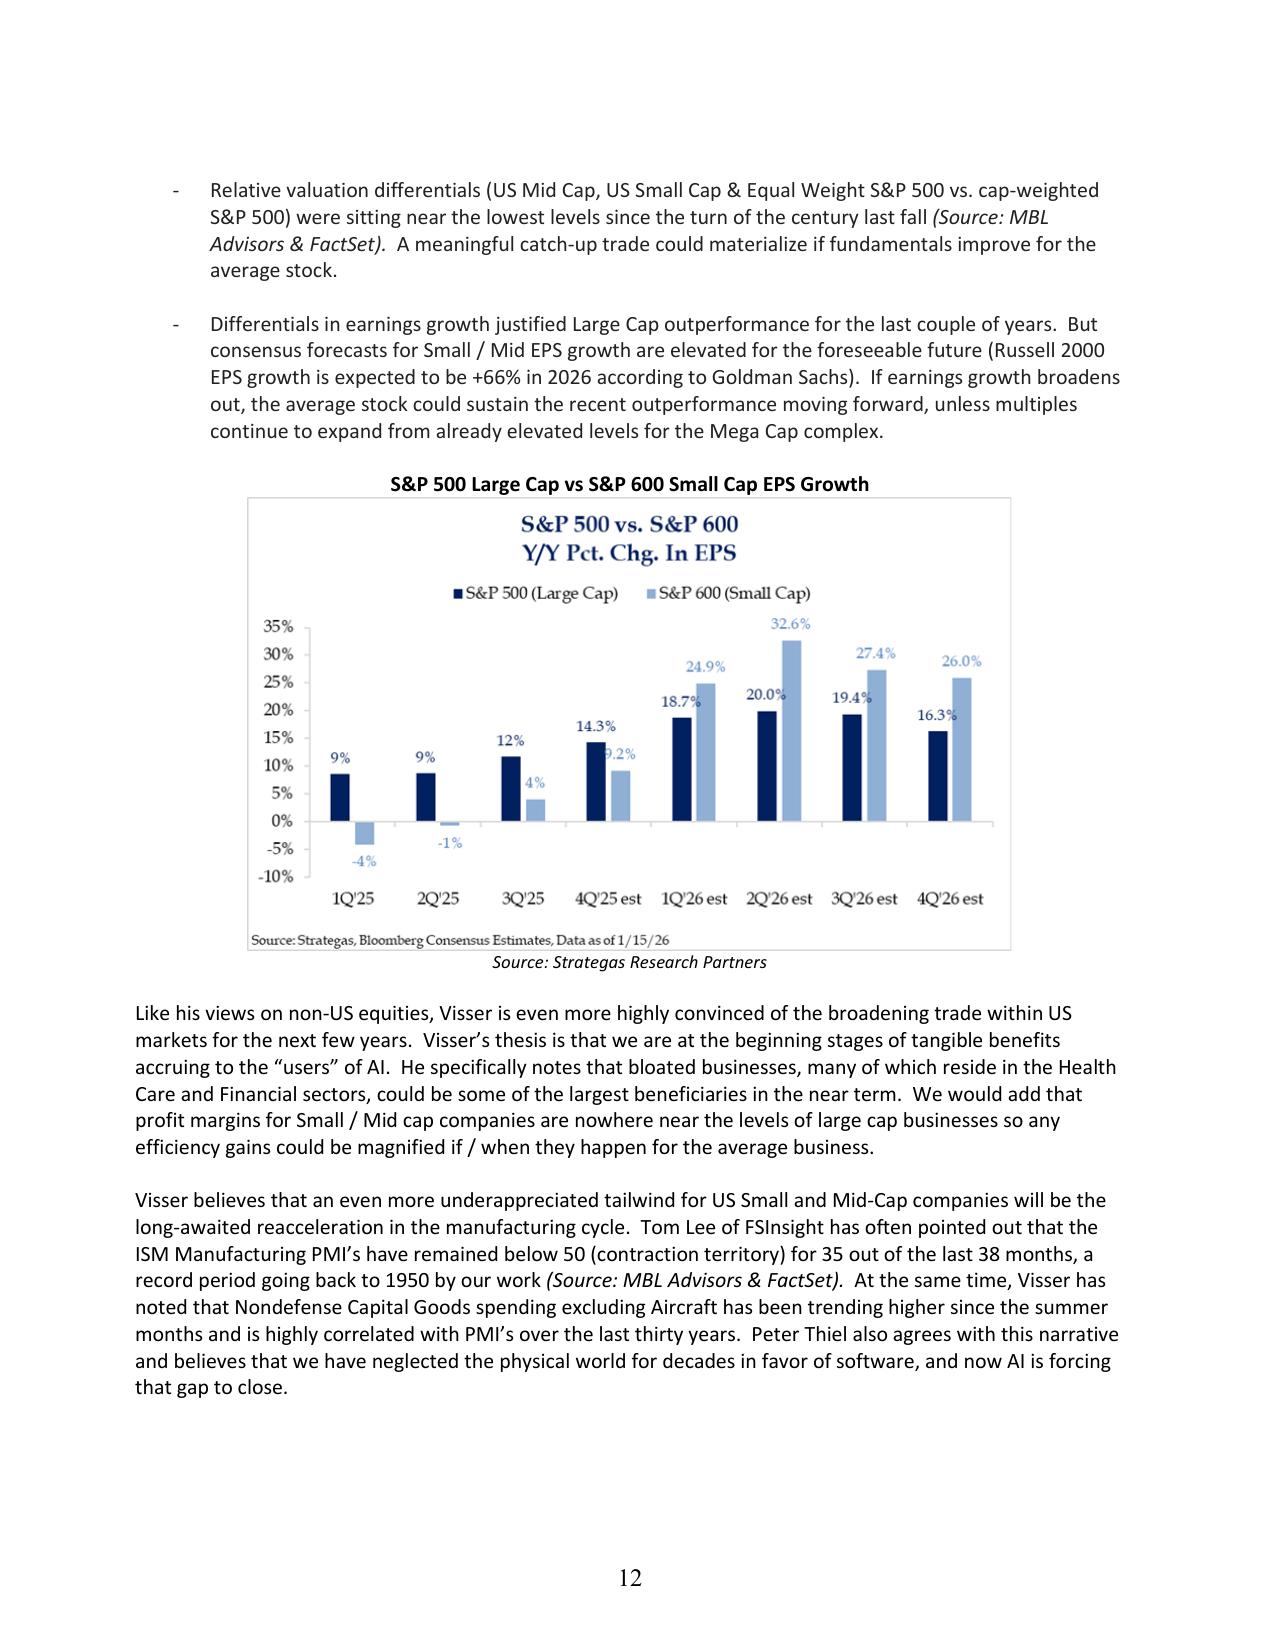
Mega Cap Technology (related) companies have carried the earnings growth for the entire market for the last two years. These businesses are expected to grow earnings at a very healthy rate again in 2025, but earnings momentum is projected to slow relative to the last several quarters. Conversely, earnings momentum is expected to accelerate across most other parts of the market (sectors and sizes) in 2025. This will be a “show me” story since investors have been waiting for this narrative to come to fruition for several quarters now. Nonetheless, if corporate America (excluding Mag 7) can deliver on the expectations for solid earnings growth, this should be an incredibly welcomed and positive catalyst for investors in 2025.
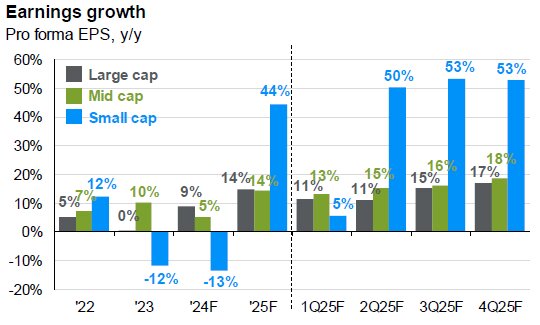
Source: JP Morgan Guide to the Markets
Further supporting the potential dynamic for a broadening out of leadership beyond the largest market capitalization names is the following analysis from John Roque, Chief Technical Strategist at 22V Research:
Dennis DeBusschere of 22V Research stated that “Small Caps have dramatically under-earned nominal growth. That is expected to revert in 2025. There is little reason to fade that outlook. This is a large part of the reason we favor small caps in 2025.”
To be clear, we favor US Mid Cap stocks over US Small Cap stocks. US Small Cap stocks have their issues, as roughly 40% of the Russell 2000 index is non-profitable and these businesses are usually more sensitive to higher interest rates. At the same time, smaller businesses could be the disproportionate beneficiaries from deregulation, and the NFIB Small Business Optimism Index has surged since the election.
In the January 2025 BofA Global Fund Manager Survey, Michael Hartnett’s “Bottom Line” was that “investors are bullish the US$ & (US) equities, bearish everything else.” Chris Verrone of Strategas Research Partners often notes that the golden rule of this business is that “sentiment follows price.” Bonds, cash, and equities outside of the United States have not given investors many reasons to be bullish over the last few years.
MBL Advisors remains meaningfully underweight non-US equities relative to our strategic targets, as we have for nearly the entirety of the last seven years. Taking a contrarian stance simply for the sake of being contrarian is rarely a good strategy in isolation. Having said this, some interesting setups may be taking shape in equity asset classes other than US equities.
European equities are trading at their largest discount ever to US equities on a forward PE basis (Source: Strategas Research Partners). Part of this dynamic is due to the premium valuations which US technology stocks are awarded by investors, and the lack of similar businesses which exist within the European indices. However, this historically high valuation premium persists when neutralizing the sector exposure between the two indices. It is also important to mention that the Euro Stoxx 600 is at all-time highs, in local currency terms. Thus, this valuation gap does not exist solely due to poor absolute performance from European equities.
President Trump recently mentioned he believed that 600,000 – 700,000 Ukrainian soldiers had been killed in the Russia – Ukraine war. He also said that Russia had lost 800,000 soldiers. These figures are 10x – 15x higher than what is being reported by Russia and Ukraine themselves. Surely Trump can exaggerate at times, but these statistics are likely more directionally accurate than the drastically lower figures Russian and Ukraine are citing. Regardless, Trump is beginning to speak about using sanctions as a tool to incentivize an end to the fighting. All else equal, European equities might demand less geopolitical risk premium if some sort of resolution is reached between Russia and Ukraine in the months ahead. The December 2024 BofA Global Fund Manager Survey noted that investors have a near record overweight to US equities relative to Eurozone equities, going back to 2001.
Chinese equities are the ultimate wild card as we enter 2025. China’s economy is nothing short of a disaster, as they are in the middle of a deflationary debt spiral, best observed through the tanking of their bond yields and their slowly weakening currency. Their one child policy of the last few decades has created a demographic time bomb, and the trick seems to be up on the centrally planned investment spending which helped catalyze their economic boom years of the past. Currently, Beijing is striving to stimulate the consumer through various measures as their economy continues to slow, and they wait to find out the extent to which increased tariffs will impact their economy. The size and scope of their stimulus response will likely be directly tied to the enviable tariff policies coming from the new administration.
We don’t pretend to have any edge in investing in China, and less than 1% of our portfolios have exposure to their equity markets. Having said this, the two best technical analysts of whom we are aware of, Jeff deGraff of Renaissance Macro and Chris Verrone of Strategas Research Partners, are both bullish on Chinese equities as we enter 2025 (shockingly, Chinese equities outperformed US equities in 2024). They believe we encountered some very rare and bullish signals in the Chinese equity markets last fall when their stimulus program was originally announced and Chinese equity markets rocketed higher for a few weeks. Cyclical sectors have continued to exhibit strong relative performance versus defensive sectors since then, while fund flows and sentiment have once again turned (contrarian) bearish (source: Jeff deGraff & Renaissance Macro).
When extending our time horizon beyond the next few months, and possibly even the next few years, it is interesting to think about the following: The United States is 4% of the global population, 25% of global GDP, 55% of global profits and near 70% of the global equity market capitalization. The US made up roughly 50% of the global equity market capitalization a decade ago. How much further can these dynamics stretch?
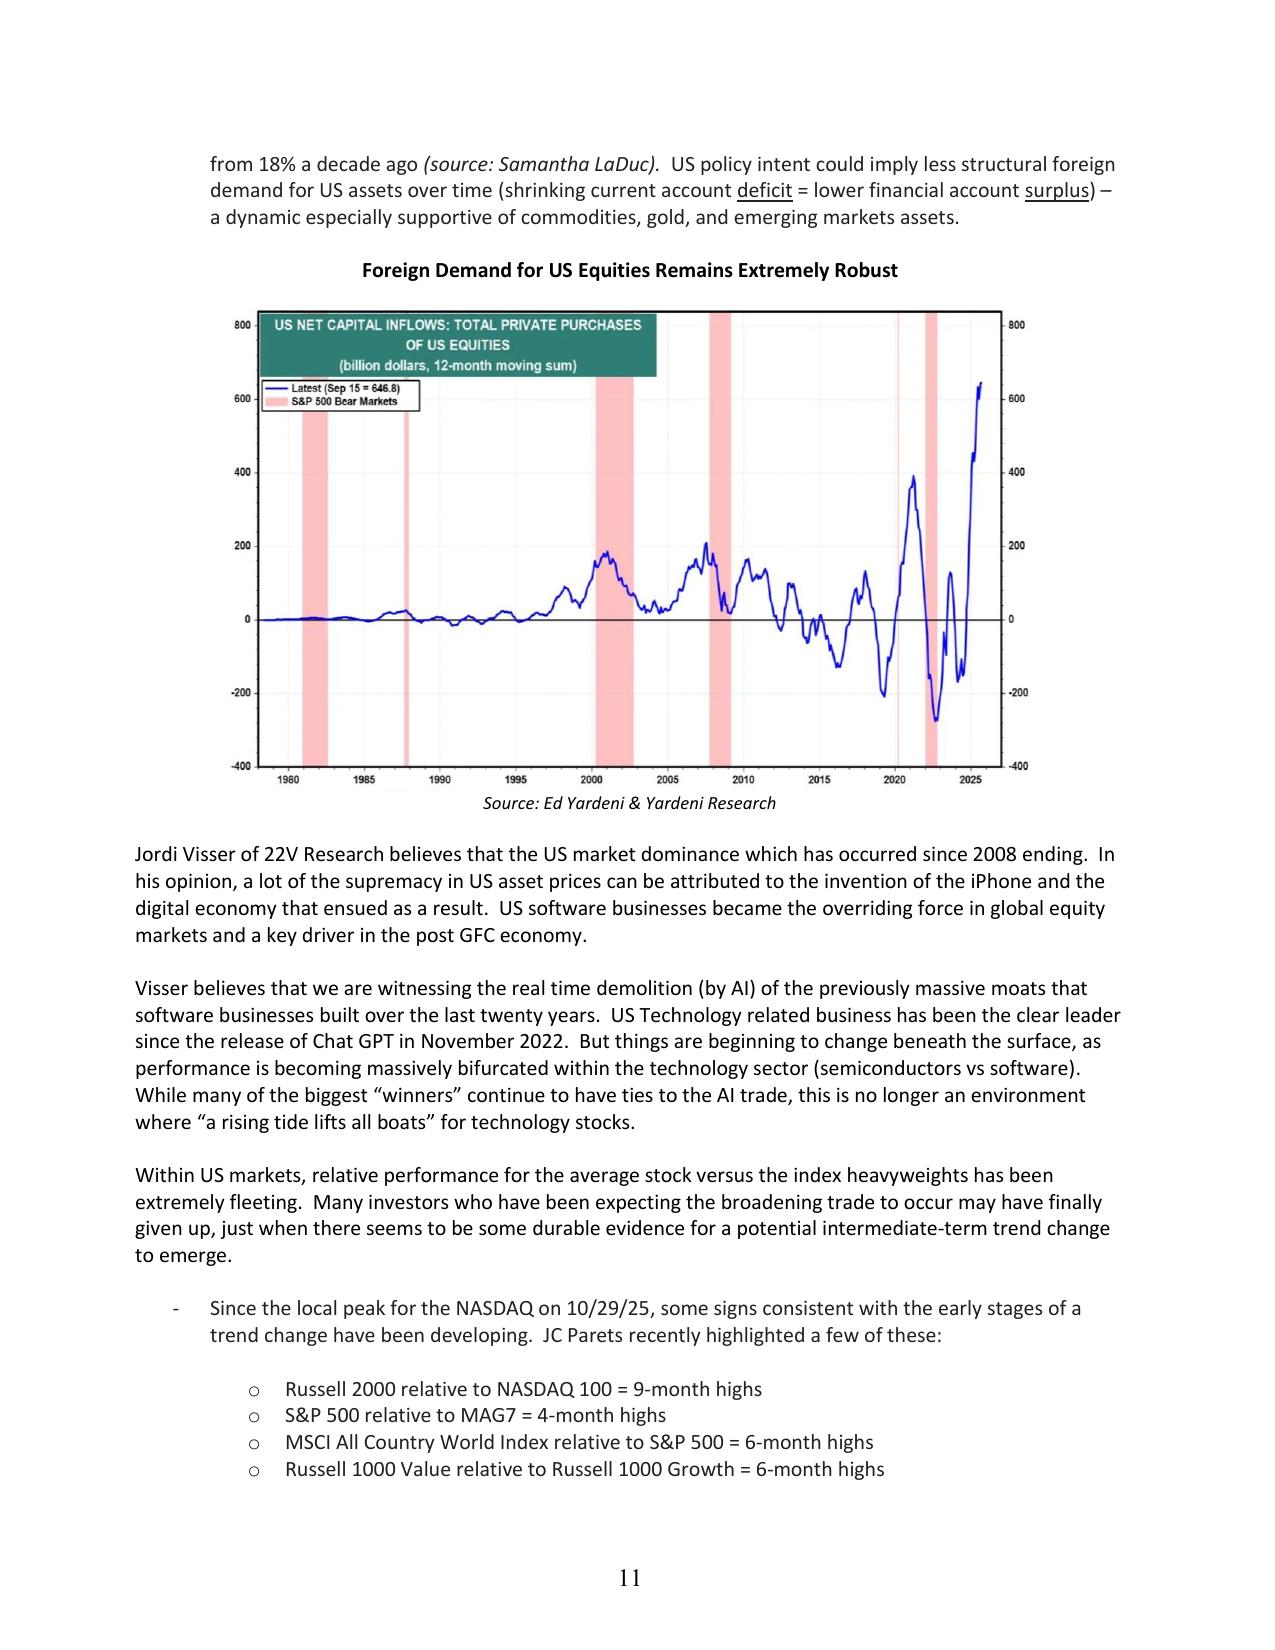
Even non-US investors have flocked to US equity markets recently. Ed Yardeni recently noted that “over the past three months, foreigners purchased US equities at a record pace of $76.5 billion. One note of caution: Their buying has a record of being a contrary indicator. They tend to be big buyers right before bear markets” (source @neilksethi).
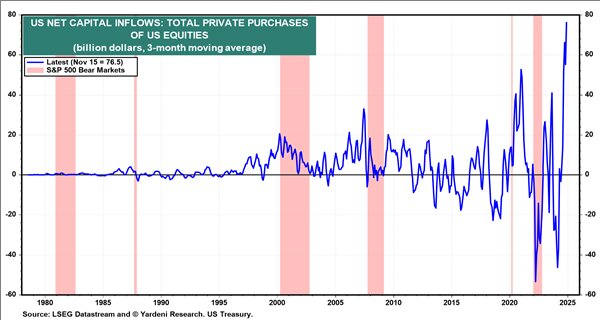
Source: Yardeni Research
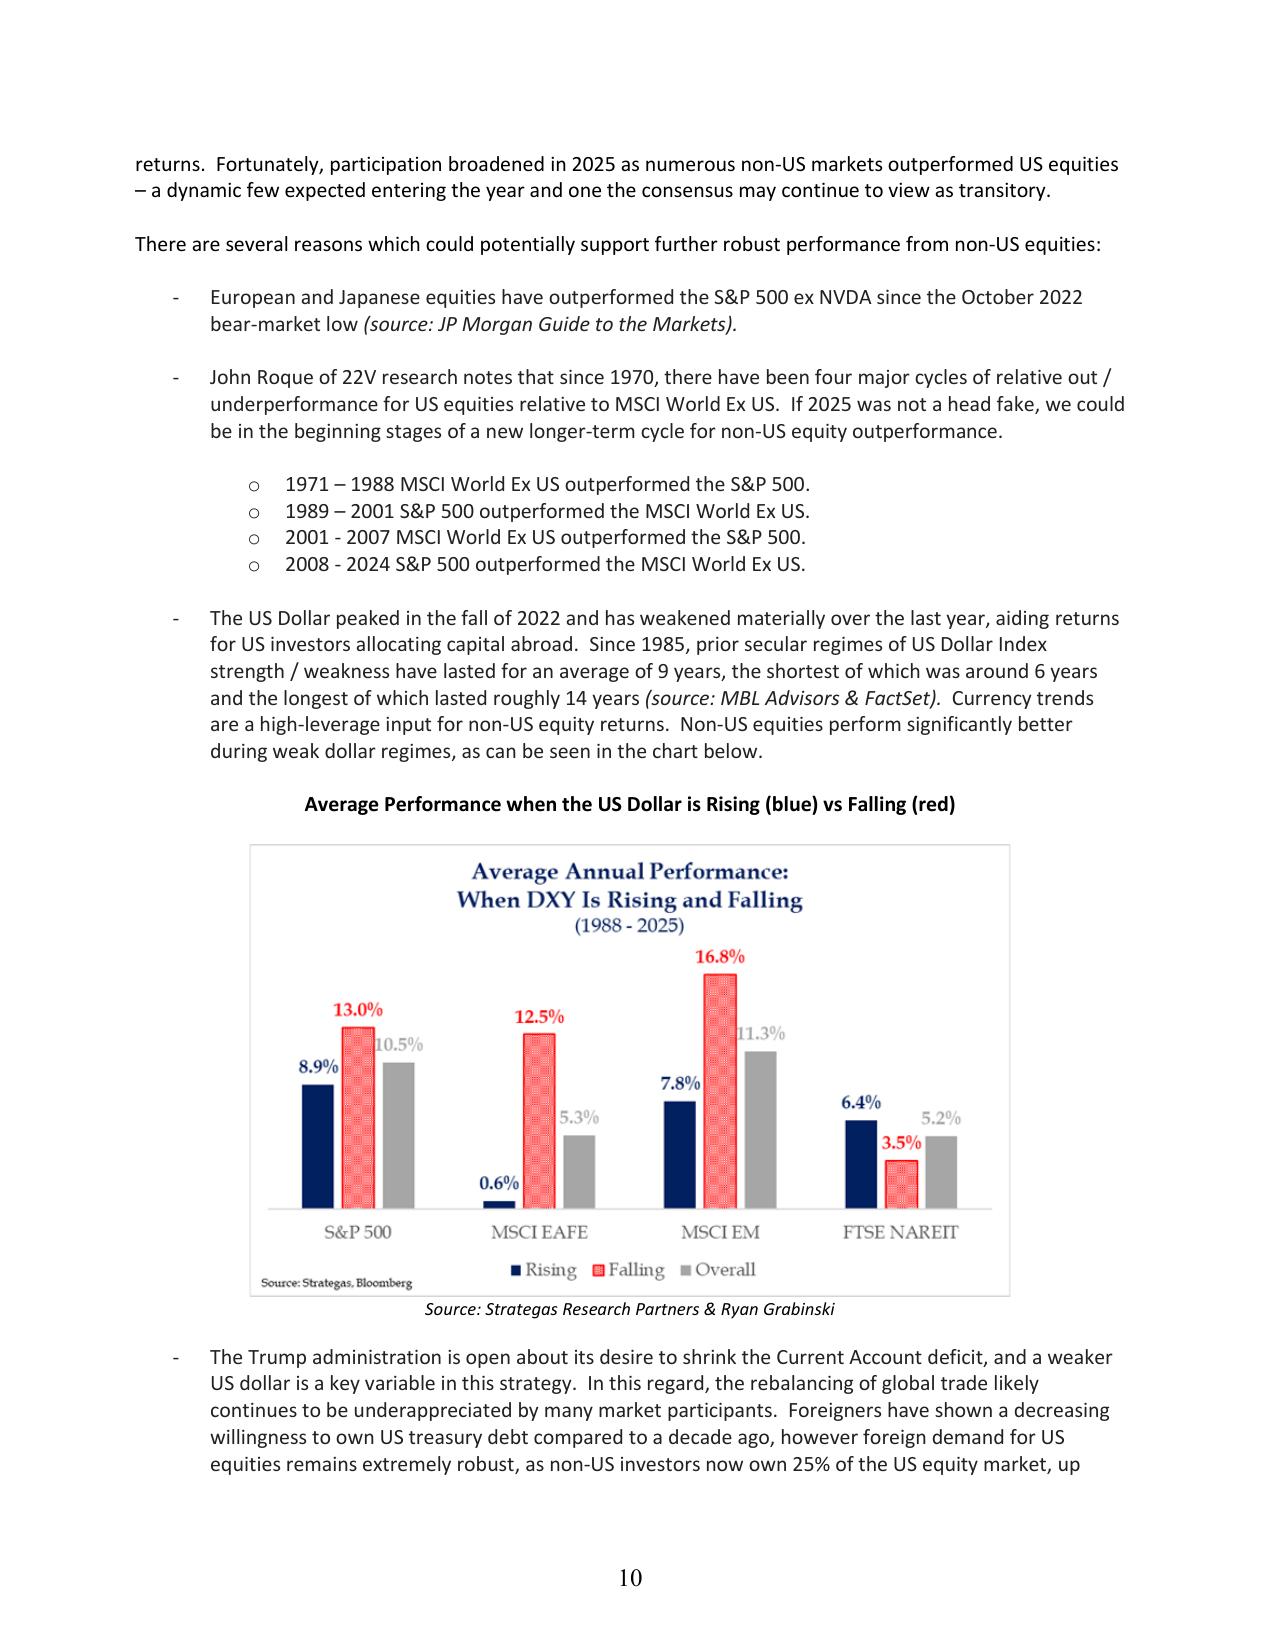
The strong US dollar has been a headwind for US investors investing capital outside of the US for over a decade. And the move higher in the USD index since the election has been pronounced. The Trump Administration’s “America First” policies, tariffs, US Tech exceptionalism, stronger growth in the US relative to the rest of the world, and higher interest rates in the US versus virtually all other developed countries are all supportive of the greenback.
Given all of these “obvious” factors, most investors are heavily positioned for further strength in the US dollar. And every time Trump opens his mouth about Tariffs the US dollar moves higher. However, an unexpected catalyst, such as a couple of relatively benign inflation readings or global growth improving relative to the US, could cause a rapid unwind of this trade. “The US dollar is trading 23% above fair value, the largest divergence on record”, according to BofA Global Research (source: @kobeissiLetter). Equity markets will likely display an increased sensitivity to moves in bond yields and exchange rates than they have at various times over the last year.
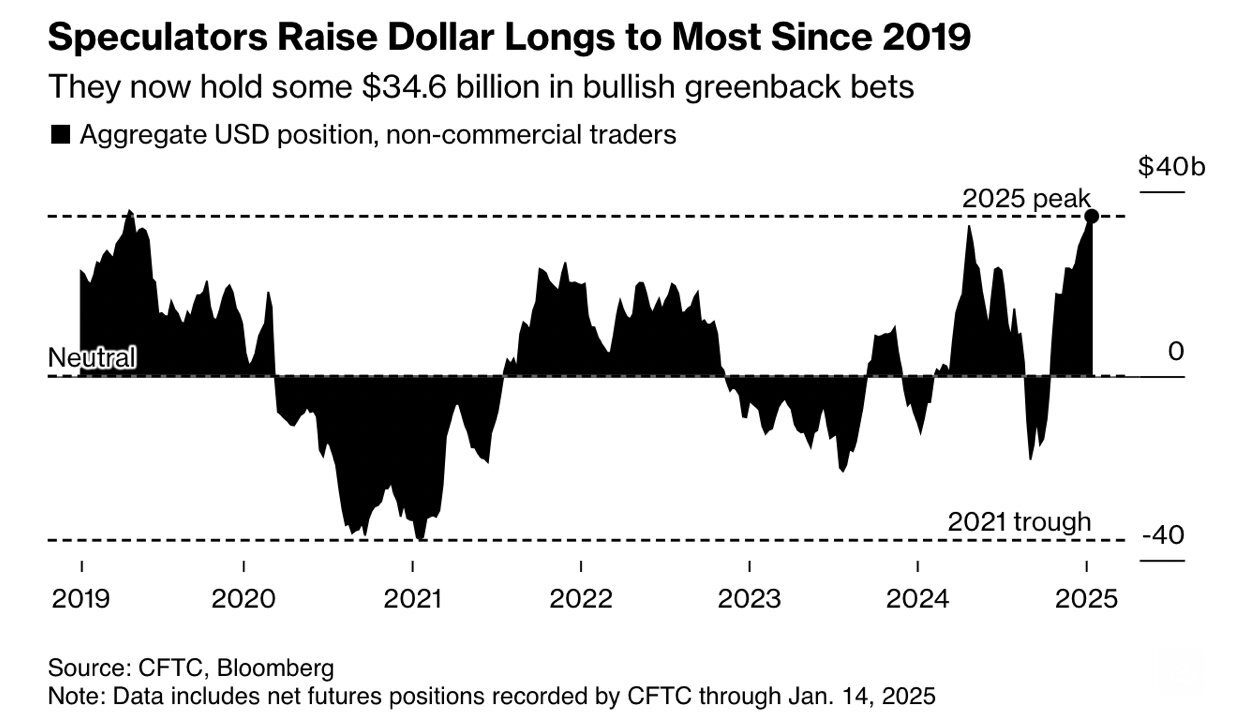
Source: Bloomberg
Finally, it was not long ago that investors dreamt of being able to achieve 4.5% – 6% yields from high quality investment grade fixed income. Although this is the reality today, many investors seem uninterested in deploying capital into this asset class. The poor performance investors have experienced in fixed income investments over recent years is undoubtedly a significant factor influencing their negative sentiment towards bonds. Jim Bianco of Bianco Research pointed out that the rolling three-year return from US Long Term Bonds is the worst stretch in 180 years.
One of the great underpinnings to the 2009 – 2021 equity bull market was the fact that stocks were fundamentally attractive relative to the historically low bond yields we experienced during that time frame. Now that bond yields have normalized, while equity valuations have continued to drift higher, the Equity Risk Premium for the S&P 500 is below 0, for the first time since the tech bubble (source: MBL Advisors & FactSet).
Theoretically, the Equity Risk Premium is the excess return investors should expect to hold (volatile) equities, over 10-year US Treasury Bonds. This metric now states that investors are no longer being compensated to own large cap equity indices, as they can earn a similar return by holding nearly risk free 10 Year Treasury Bonds.
Having said this, we believe the Equity Risk Premium is a somewhat flawed metric in the sense that bonds don’t have two important traits which US Large Cap equities exhibit in a meaningful way. First, equities are a real asset, and thus a good hedge against inflation, over longer time frames. If inflation and nominal growth have a higher resting heartbeat, as they have since COVID, this metric could be overstating the attractiveness of bonds relative to stocks. Second, the S&P 500 has an increasing amount of exposure to “innovation”, which is a primary source of the currently high valuations, while fixed income clearly has no upside optionality.
As we have stated in the past, we are grateful not to have to play the thankless game of publishing S&P 500 targets. Charlie Biello of Creative Planning noted that PE multiples expand or contract by at least 10% in 70% of calendar years. Outside of major economic turning points, Wall Street is fairly good at forecasting earnings estimates for corporate America. However, forecasting valuations for the market has been nearly impossible, especially during this era of excess liquidity. Nobody believed the S&P 500 would trade back to multiples we witnessed during the COVID mini bubble, but that is precisely what happened in 2024 for US Large Cap equities.
Entering 2025, most strategists are extrapolating the S&P 500 trading at 22x forward earnings as the “new normal” at least for the time being. However, history says investors should bet on the S&P 500 trading either above 24x NTM EPS (this seems very difficult to imagine, but so did getting to these valuations in the first place) or below 20x NTM EPS by the end of this year. Holding 2026 earnings growth steady at today’s forecast, this would mean that there is a 70% probability that the S&P 500 finishes 2025 either below 6000 or above 7200. Of course, most strategists’ forecasts squarely between these two bookends. This serves as a good reminder that the stock market is far more volatile than its underlying fundamentals.
| Statistic | Average % Return the Following Year | % of Positive Years | Sample size | Data Since | Source |
|---|---|---|---|---|---|
| The S&P 500 does not close below its 200 Day Moving Average in a given calendar year (2024) | 4.62% | 55.00% | 11 | 1950 | Bespoke Research |
| Year 3 of a Bull Market (Nov 2024 – Nov 2025) | 4.80% | 67.00% | 12 | 1932 | Strategas Research Partners |
| Year after two Positive Years in a row | 5.20% | 67% | 18 | 1936 | BofA Global Research Stephen Suttmeier |
| Decennial Cycle Year 5 | 20.70% | 92% | 14 | 1885 | NDR Research |
| Stock Performance after Years with over 50 Record Highs (2024) | -3.00% | 28% | 7 | 1928 | NDR Research |
| Year 1 of Presidential Cycle (2025) | 6.60% | 58% | 14 | 1928 | BofA Global Research Stephen Suttmeier |
| Positive January in Year 1 of Presidential Cycle (2025) | 13.90% | 79% | 14 | 1928 | BofA Global Research Stephen Suttmeier |
| Presidential Cycle Year 1 (2025) following up years in both Year 3 (2023) & Year 4 (2024) | 1.90% | 63% | 8 | 1936 | BofA Global Research Stephen Suttmeier |
| 4 Straight days with more than 70% of S&P 500 stocks advancing (1/19/25) | 10.63% | 92% | 12 | 1990 | Seth Golden |
| S&P 500 has at least 4 losses > -1% in days within 30 days of a Record high (January 2025) | 9.90% | 70% | 20 | 1928 | Sentiment Trader |
As inflation fears creep back into the headlines, criticizing the Fed for being too Dovish has become popular again, although it was only four short months ago when many of these same prognosticators believed the economy was weakening and the Fed was too tight. The Fed began their cutting cycle in September 2024 by reducing the Federal Funds rate by 50 basis points. Since then, they have made two additional 25 basis points cuts to their policy rate. The unique thing about this cutting cycle is that the 10 Year Treasury yields have increased by roughly 1% since the Fed began their cutting cycle. A 200-basis point steepening between the Federal Funds Rate and the 10-year Treasury, four months into a cutting cycle, is unprecedented.
Bond yields accelerated their assent higher when Federal Reserve Chairman Powell mentioned that their “inflation forecasts have kind of fallen apart” in his press conference after the December FOMC meeting. In addition, the minutes from the December FOMC meeting show that most voting members believe that inflation risks are to the “upside” relative to the FOMC’s base case forecasts for inflation over the coming year. This is in stark contrast to the minutes from their September meeting when most FOMC members believed that inflation risks were “balanced” (source Neil Dutta & Renaissance Macro). Neil Dutta, Chief Economist at Renaissance Macro, pointed out that it is very clear what is occurring, which is the Fed is incorporating Trump’s tariff plans into their forecasts, despite Powell being adamant about the fact that they are strictly “data dependent.”
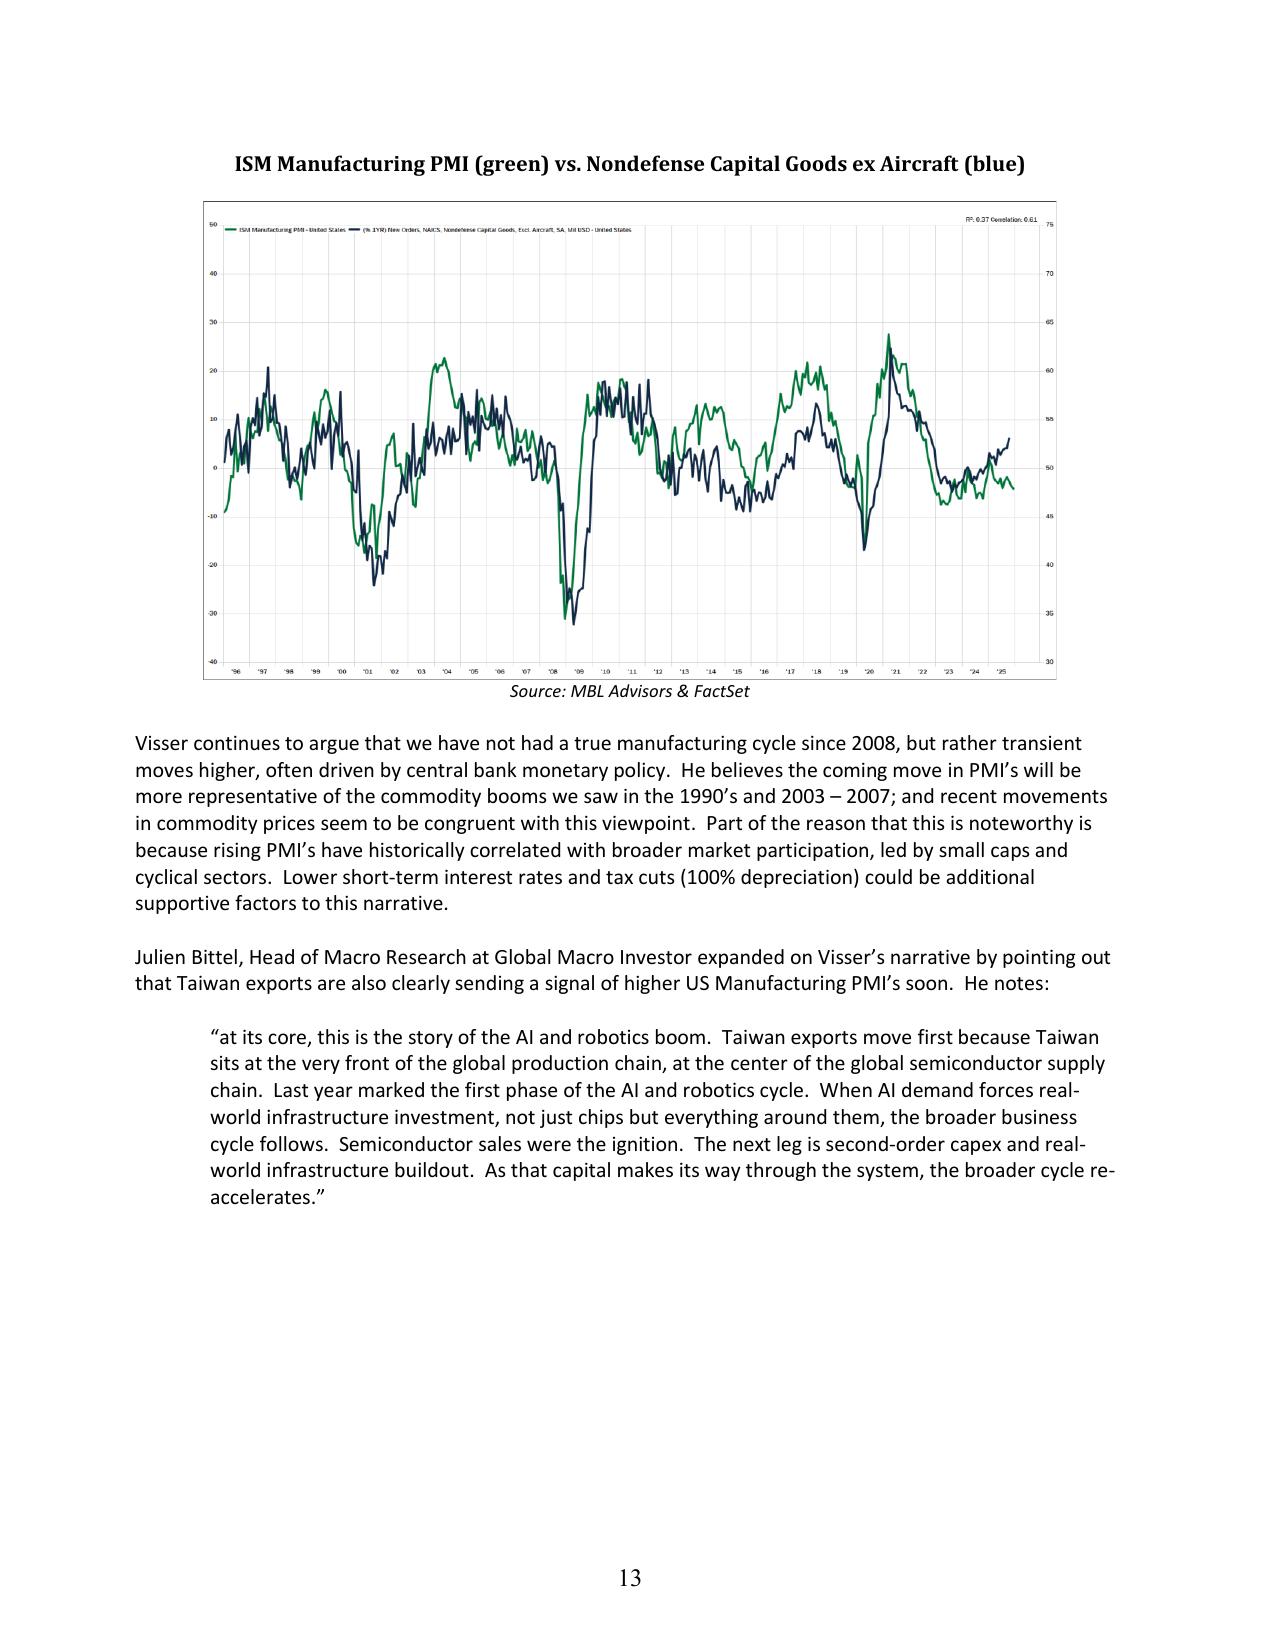
The trend for rising inflation forecasts has not slowed much in 2025, as the ISM prices paid by purchasing managers index (leading indicator for CPI) hit a 22-month high.
All of this is happening while the money supply (M2) is beginning to accelerate again. Possibly the greatest economist of all time, Milton Freedman, is famous for saying that “inflation is always and everywhere a monetary phenomenon.” This is to say, inflation is always as simple as an increased amount of dollars chasing the same amount of goods.
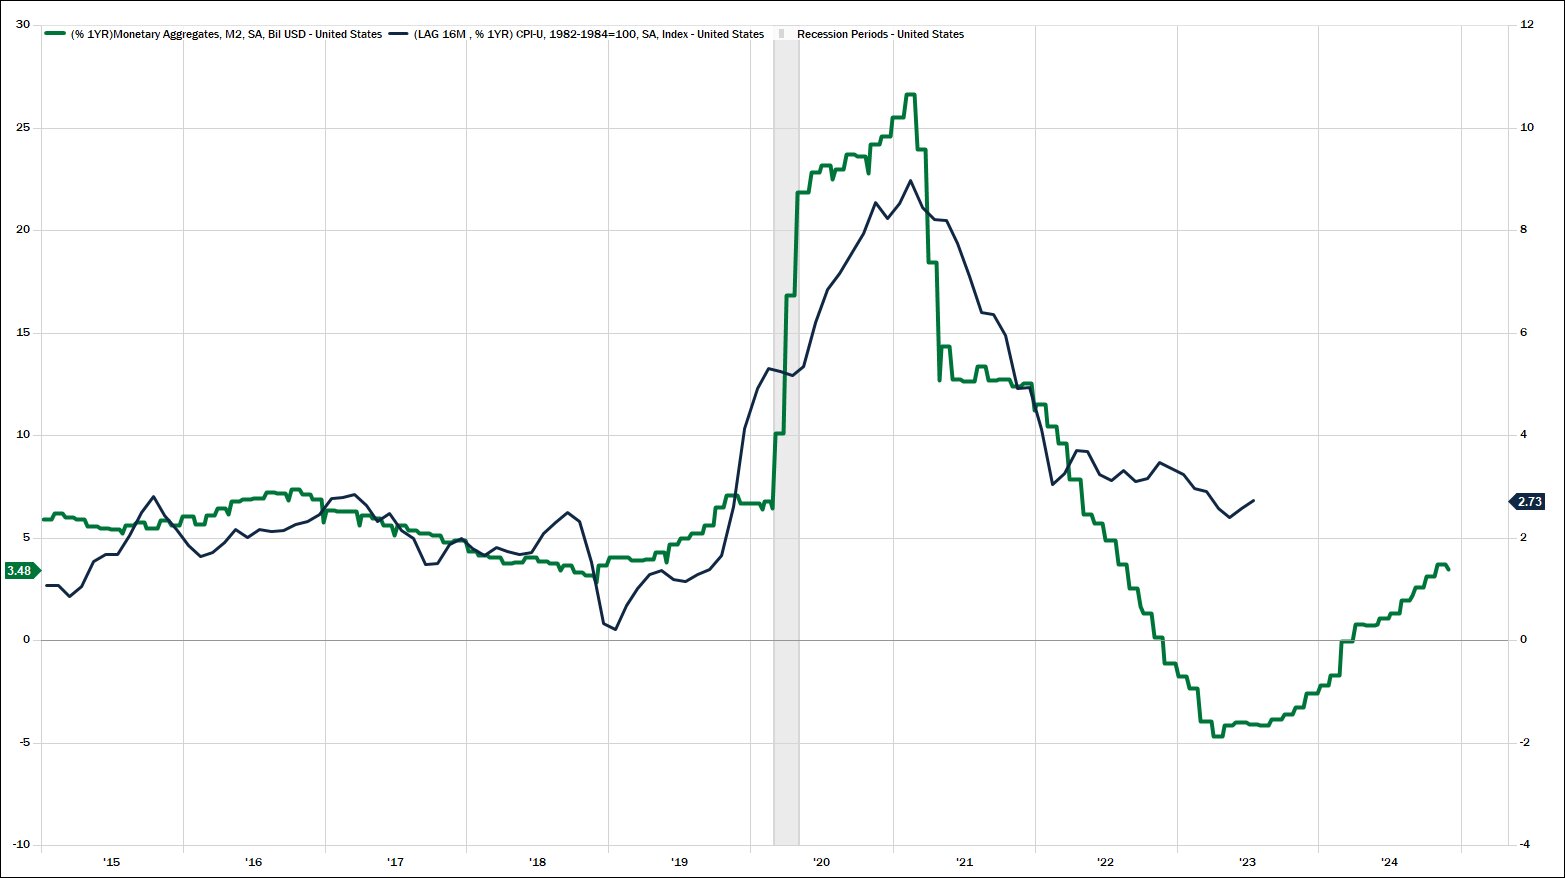
Source: MBL Advisors & FactSet
For two years, Don Rissmiller of Strategas Research Partners has been mentioning that there is an 87% chance for developed economies to have a second wave of inflation once a given economy experiences a first significant bout of it. The now famous chart below comparing the current path of inflation vs. the 1970’s (dual scale) shows that a second wave of inflation would begin in 2025 if the 1970’s roadmap was followed again.
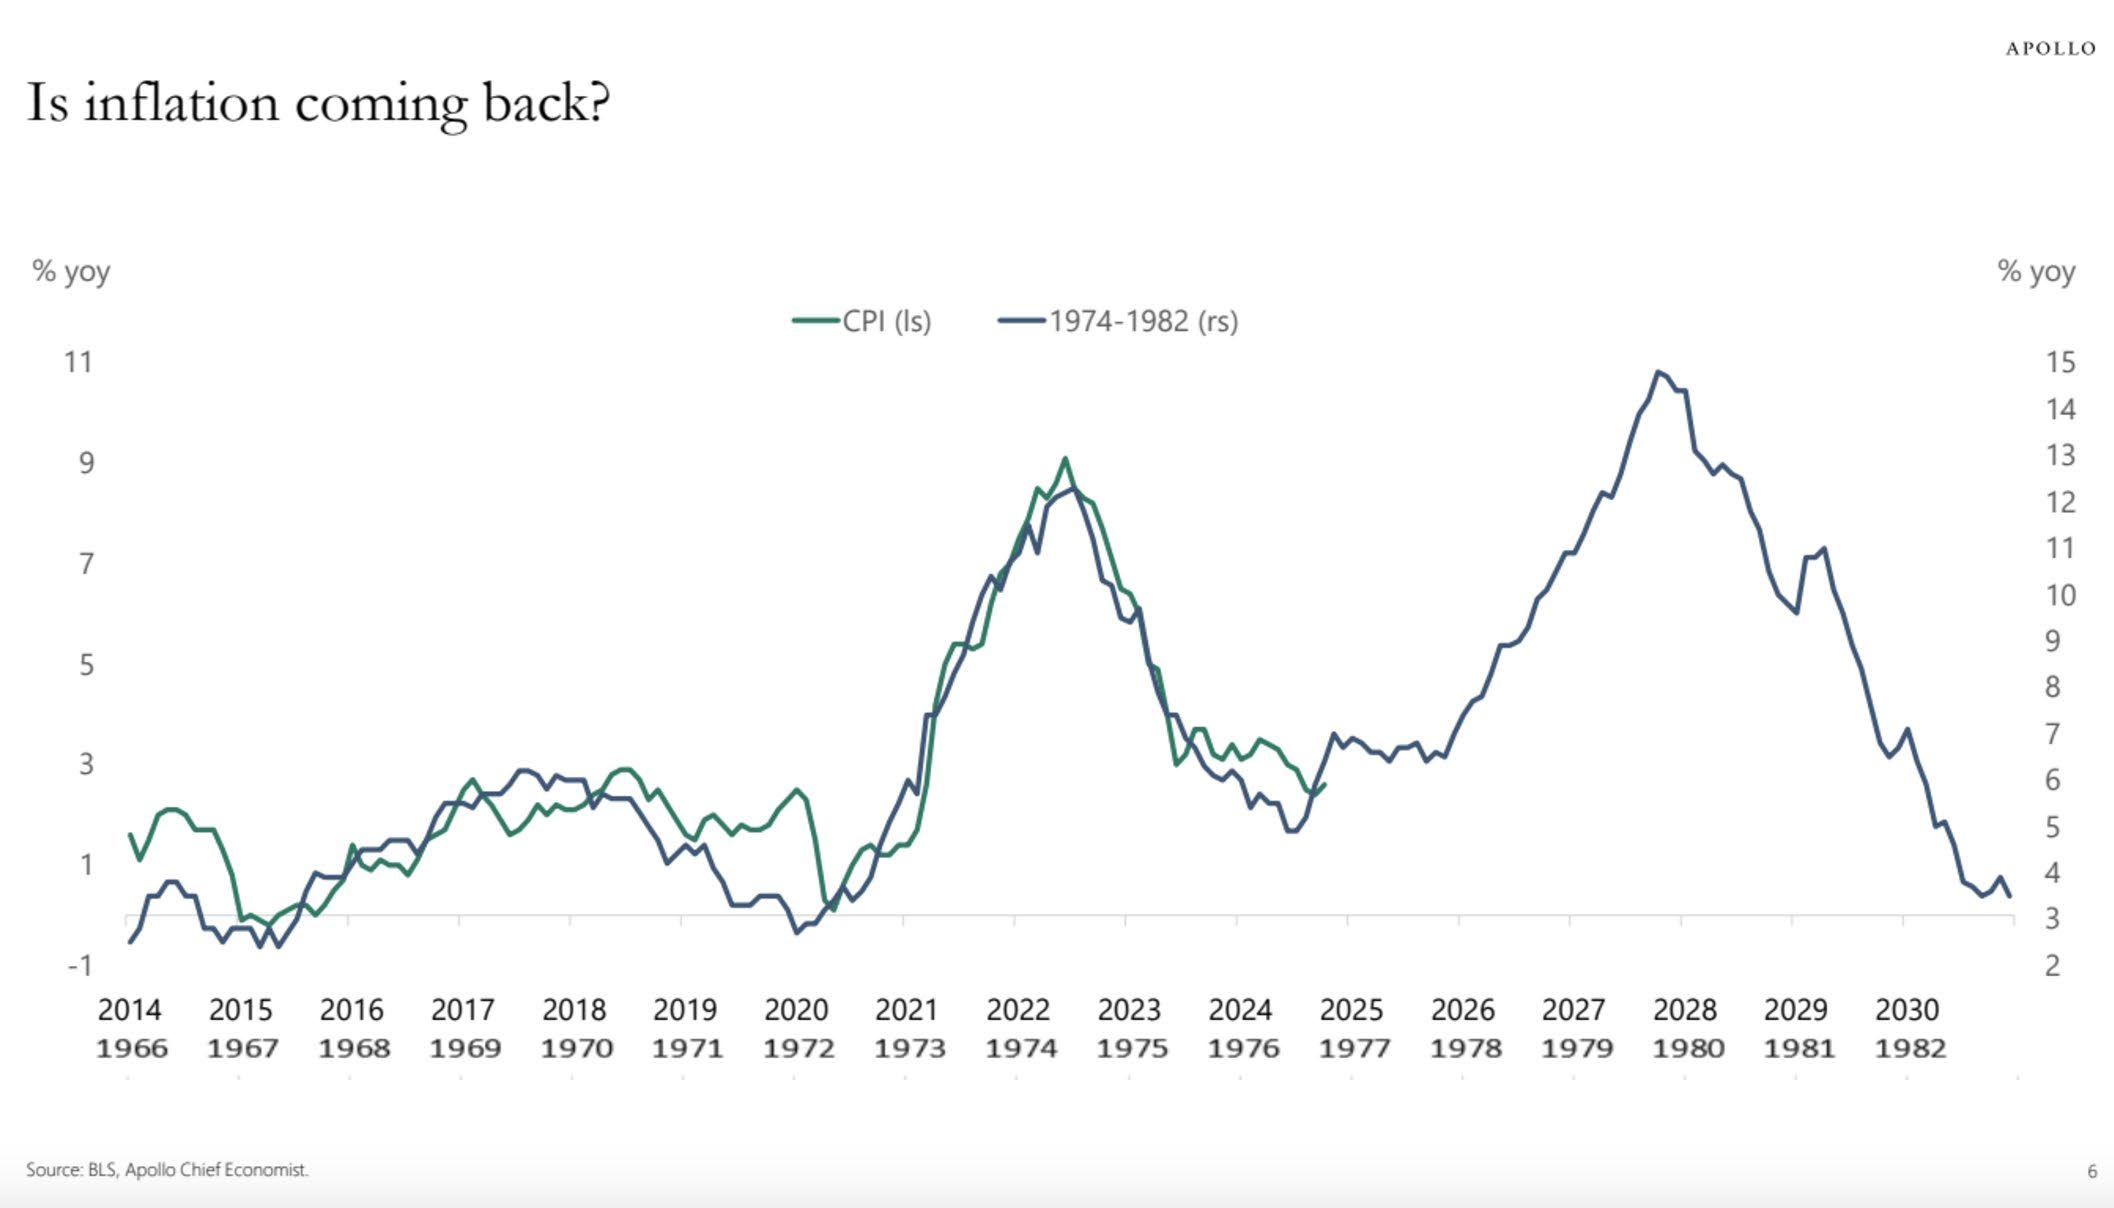
Source: Apollo & Torsten Slok
Although we believe there is plenty of credence to the narrative that inflation will remain sticky and elevated above the Fed’s 2% stated target, we also believe the second wave of inflation thesis is overblown, at least for the next six to nine months.
Neil Dutta from Renaissance Macro believes the job market is showing some signs of softening underneath the surface. Not necessarily to problematic levels for the economy, as layoffs remain low, but the quits rate is down to 2.1%, the lowest level since April 2015 (excluding the spring of 2020). The quits rate is a terrific leading indicator for wage growth. Dutta stated that “the continued slide in the quits rate implies little need for firms to pay up workers; thus, I would anticipate continued slowing in compensation growth in the quarters ahead.” Dutta went on to mention that ISM prices paid reflect tariff fears, not underlying inflation, and new job postings remain weak.
Dutta is one of many economists who have noted that the housing market cannot handle 7% mortgage rates. Home building stocks are not trading well, as new home inventories continue to grow. This thesis was collaborated on January 23, 2025, when the BLS All tenant Rent Index, a leading indicator of shelter inflation, hit fresh cycle lows of 3.18%. Dutta went on to mention that the New Tenant Rent Index actually contracted by -2.4%. Dutta stated that the NTR is often directionally accurate but can overstate the degree of change at times. The bottom line is that if shelter inflation cools to the degree that Dutta and some other economists expect, there could be downside risks to inflation relative to consensus expectations in the months ahead.
Basic fixed income principles dictate that economic growth expectations and inflation expectations are the primary drivers of bond yields, aside from the very short end of the yield curve which the Fed controls.
Newfound beliefs regarding a resurgence of inflation have caused some investors to use the rise in bond yields to support their inflation claims. To be fair, 5-year breakeven rates are up more than 50 basis points since Fall 2024, but those were the cycle lows, and 5-year breakeven rates are hovering around 2.5% today, which seems like a very reasonable level of inflation expectations for the next several years.
In our opinion, the larger issue for bond yields is that investors are rightfully demanding an increased term premium to hold longer dated bonds given the higher levels of uncertainty associated with such maturities. In this regard, the abnormally flat yield curve we have witnessed for a large portion of the last 15 years was largely an anomaly, and a byproduct of hyperactive central bank intervention.
Jason Trennert from Strategas Research Partners recently wrote: “to the extent to which all Presidents, Democrat or Republican, grease the skids for their re-election, it was not particularly surprising that the Biden Administration used its powers to boost the economy and the financial markets. But the sheer range of tools used – the TGA, the SPR, student loan forgiveness, the Treasury Department’s suspension of the coupon issuance, not to mention a budget deficit of nearly 7% of GDP – was, indeed, breathtaking and unprecedented for an economy near full employment. With a debt ceiling debate looming and the Fed’s reverse repo facility falling to $240B from $2.5T at the start of 2023, there is a chance that the long-term interest rates could rise simply on the supply issuance alone. In short, the Trump Administration is inheriting an economic mess if it is serious about putting the country on a more sustainable fiscal path.”
An oversimplified rule of thumb is that 10-year Treasury yields should loosely track the rate of Nominal GDP growth over time. In this regard, 4.5% +/- 10-year bonds yields are not elevated, relative to the current growth rate of the economy.
We may have never publicly written about such a polarizing subject as President Trump. We recognize the people reading this will have wide ranging viewpoints regarding the President, and thus we will strive to remain as objective as possible. In this regard, we will begin with two important reminders:
Stocks have done well regardless of who the President has been throughout history. The exceptions to this rule are Hoover & FDR during the Great Depression and George W. Bush, who began his presidency with the biggest asset bubble in the history of our country and ended with the largest financial crisis since the 1930’s.
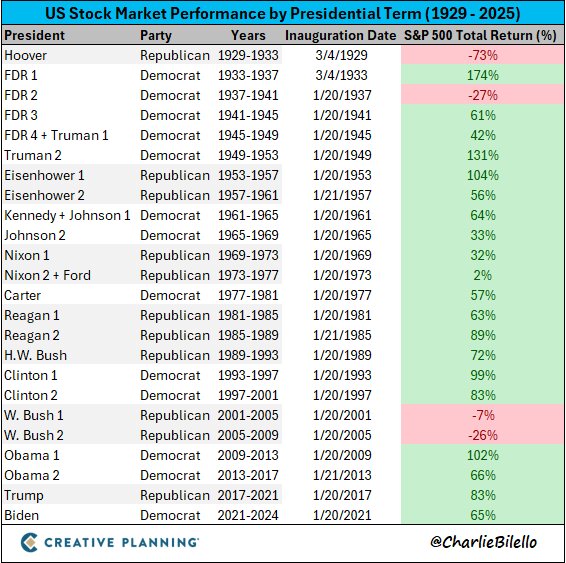
Source: Charlie Bilello & Creative Planning
Second, recognizing our own biases is a useful trait in investing. According to the University of Michigan survey on inflation expectations, Republicans’ expectations for inflation have crashed since the election. This comes after two straight years when Republicans’ expectations for inflation were well above most official inflation metrics. Conversely, Democrats’ expectations for inflation have spiked since the election. This contrasts with the last four years when Democrats’ expectations for inflation were below most official inflation readings, with the wisest gap of expectations versus reality occurring during the summer of 2022.
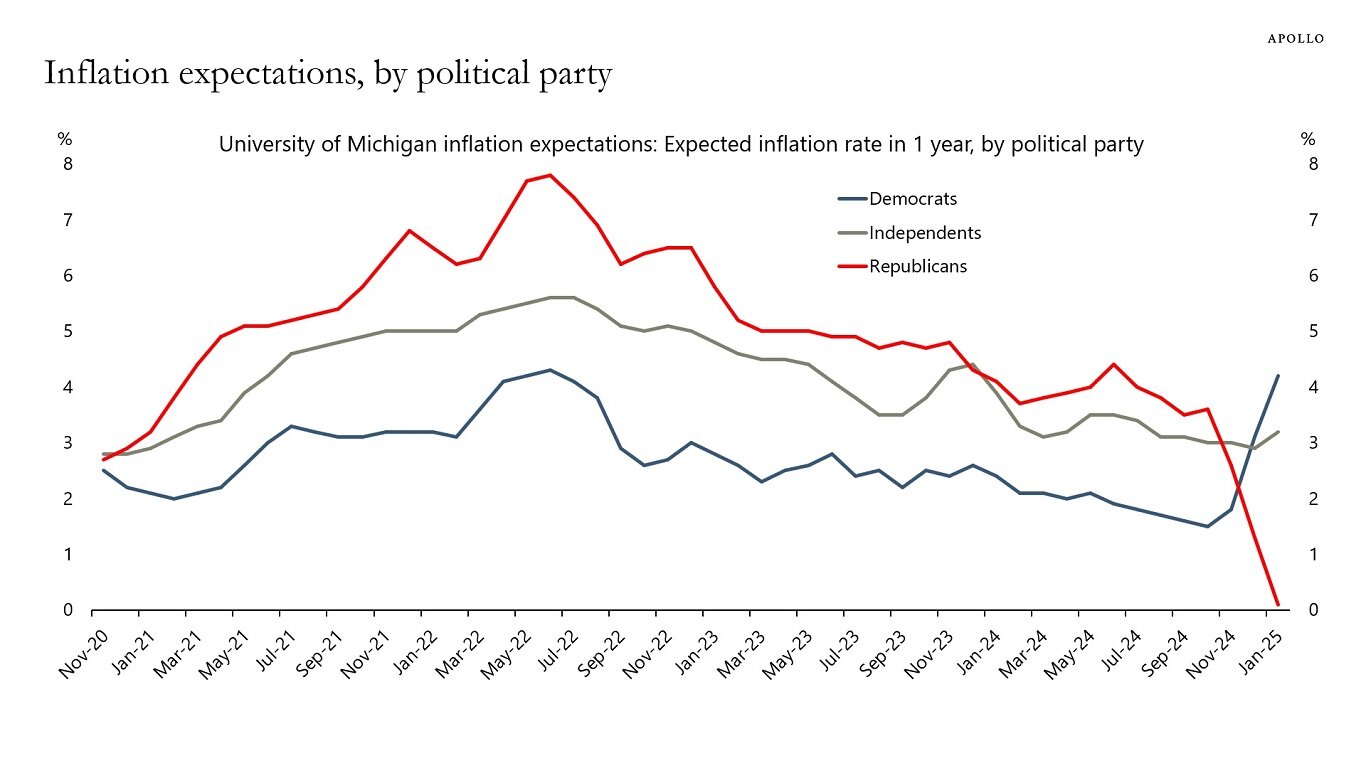
Source: Apollo & Torsten Slok
We highlighted the partisan dynamics in this inflation survey as a reminder to not let politics blind us as investors, in either a bullish or bearish sense. Most experts believe that Trump is inheriting a relatively low bar when it comes to improving business-friendly economic policies. Conversely, the bar is quite high, in the opinion of the market, as to how effective his pro-growth policies might be.
It has only taken a week with President Trump back in office for us to be reminded how aggressive he is in pursuing his policy agenda. Both humans and markets alike often hate uncertainty more than bad news itself. Trump is the ultimate disruptor, and this will likely cause volatility in markets in the months and years to come.
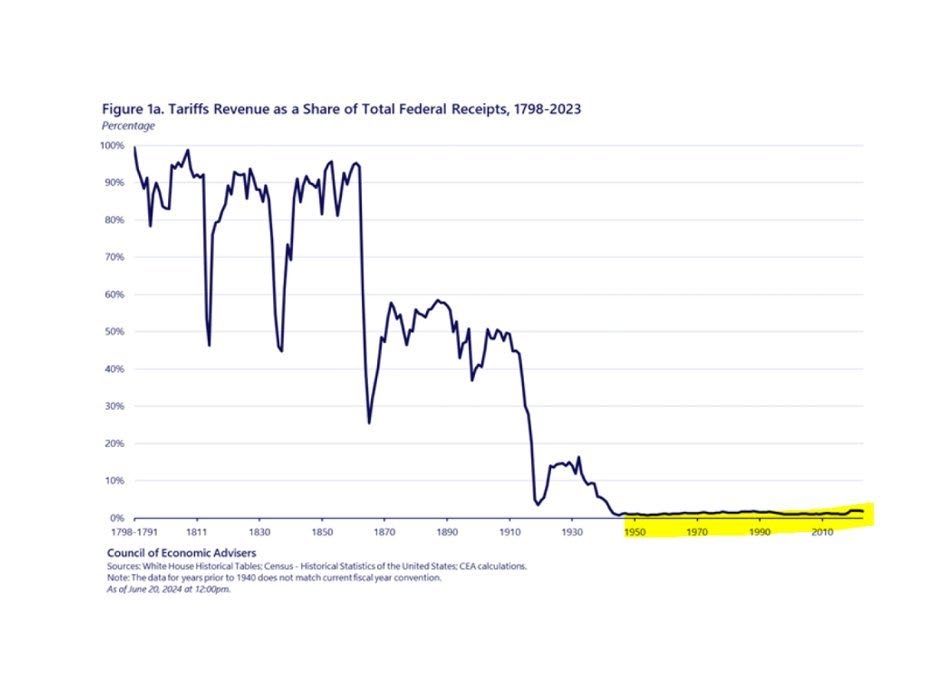
Source: Council of Economic Advisors & Marc Andreessen
Uncertainty around Trumps policies will likely cause some uneasiness for investors at various times this year, as they are the epitome of unconventional in many ways. Having said this, many of the policies which became “normalized” over the last 15 years were moving towards an unsustainable path, most notably the trajectory of government spending.
AI capabilities are rapidly evolving and have been an increasing underpinning to the US equity markets since ChatGPT was first released in November 2022. Monday 1/27/25 seemed to be a milestone day in the evolution of AI as the Chinese startup DeepSeek launched its latest AI chatbot. The massive buzz around DeepSeek is concisely summarized by Peter H. Diamandis, MD:
Most experts do not believe DeepSeek trained their new models with the modest costs and technology which they claim. In fact, the Financial Times reports that DeepSeek likely spent over $500M on Nvidia chips, despite their low-cost claims. Regardless, even modest cost and efficiency improvements around AI are a positive development. Even Nouriel Roubini, who often finds a way to have a pessimistic viewpoint on economic issues wrote: “In my modest opinion the DeepSeek surprise / shock is – counterintuitively – over time bullish for US and global stocks as it is another positive global aggregate supply shock that increases US / global potential growth and makes exponential AI even more exponential” (source: @Nouriel).
Microsoft’s CEO Satya Nadella elaborated “Jevons paradox strikes again! As AI gets more efficient and accessible, we will see its use skyrocket, turning it into a commodity we just can’t get enough of” (source: @satyanadella).
Dan Niles, the famous hedge fund manager and founder of Niles Investment Management, shares some of his opinions on X after the DeepSeek news.
It is interesting to note that on their earnings calls on 1/29/25, Microsoft validated the narrative that their growth rate in AI spending is set to slow in the years ahead (not cutting CAPEX, but slow growth). Conversely, META said it is full speed ahead with regards to their AI CAPEX, noting that “the ability to build out this kind of infrastructure will be a major advantage” (source: @TheTranscript).
The evolution of AI is moving so rapidly even the experts seem to be having trouble keeping up. The sheer speed of progress will often leave investors with more questions than answers at times. How will the massive AI CAPEX spending ultimately be monetized (beyond the AI infrastructure companies who are the beneficiaries of the CAPEX such as NVDA, AVGO, etc.)? The estimates for increased energy sources to power the data center build outs are nothing short of staggering. But does the increased energy efficiency displayed by DeepSeek alter these estimates? What industries will most effectively use AI as a tool to increase their product offerings and their profit margins? Regardless of these questions, AI only seems to be further solidifying itself as a massive trend for the next several years. The broadening benefits of AI should be a positive development for the global economy in the decade ahead, especially given the aging demographics across the developed world.
The next few years will likely be an incredibly different market environment than the last few, and there seems to be an endless list of potential catalysts which will impact capital markets in the months ahead.
US equity markets seem to be trading in a more extreme fashion since COVID. Markets move more quickly, valuations seem to be near irrelevant over short time horizons, and speculation has become somewhat normalized across certain asset classes.
Very few investors would disagree with the claim that animal spirits are running wild at the moment, and a day of reckoning will come for some of these issues eventually. At the same time, we are in a bull market until proven otherwise and fighting the prevailing trends within markets has rarely been a profitable strategy for investors. Don Rissmiller, Chief Economist at Strategas Research Partners, recently published a report titled “The U.S. Economy Doesn’t get in big Trouble until Profits fade.” This says nothing about the direction of the next 10% move for equity markets. But it is a great reminder that bear markets and recessions occur when corporate profits are contracting, or at least flatlining. The profitability profile of corporate America is strong, despite an unsynchronized economy. Interest rate sensitive parts of the economy such as durable goods, housing, and corporate deal activity have remained depressed for the better part of the three years and could offer fresh upside catalysts.
Despite the government’s spending antics, consumer and corporate balance sheets have massively repaired themselves since 2008 and remain in solid shape today. According to JP Morgan’s Guide to the Markets, US consumers have nearly $190 Trillion of assets and $21 Trillion of liabilities. Torsten Slok of Apollo stated that the household debt to asset ratio is at a 50-year low. Slok continued to note that US nonfinancial corporate net interest payments are near record low levels.
The third year of a bull market can often be somewhat of a digestion phase for markets. At the same time, numerous sectors of the market are expected to finally experience reaccelerating earnings growth, and expectations don’t seem overly demanding outside of the US exceptionalism trade that has worked so well for the last two years.
With earnings growth on solid footing, rhetoric from policy makers, and their corresponding impact on interest rates seem to be front and center to begin this year. In this regard, it is important to note that stocks and bonds have largely become positively correlated since COVID, which is a drastic change from the prior 30+ years. Because of this, maintaining or even increasing diversification within portfolios is more important than ever. Historically, bonds are not the best asset classes when inflation levels are elevated, but they do provide ballast to portfolios for the first time in several years and could even hold their own relative to US Large Cap equities if the less optimistic forecasts from Goldman Sachs and BofA Global Research prove to be accurate in the years ahead.
We believe Uncorrelated Assets are an increasingly attractive asset class, both for diversification purposes as well as their expected return profiles. For clients with a tolerance for illiquidity, private investments should warrant serious consideration as a potential addition to portfolios.
Like many investors, we are rooting for the expected broadening of fundamentals and corresponding performance from various asset classes. Dennis DeBusschere of 22V Research recently wrote: “Historically, lower unemployment readings favor more Risk-on and Value driven internals. Combining sensitivities to unemployment and inflation, a lower unemployment rate together with stable inflation (our call) favors Energy, REITs and Financials, while Communications, Tech and Health Care underperform. Higher unemployment and inline inflation led these sector performances to reverse. Value, Deep Cyclicals and Small Caps would work relative, along with foreign markets, IF the US exceptionalism trade reverses. To be clear, we are not short the mega caps. We are just noting that the macro backdrop driving the US exceptionalism narrative (USD going straight up) is likely to be less of a tailwind as European / China growth stabilizes. Assuming our benign tariff policy outcome is correct.”
Richard Bernstein, the Chief Investment Officer at RBA Advisors, offered some interesting perspective when he mentioned that in some instances, investors have begun to view diversification as a hindrance to upside, rather than a tool to achieve financial goals.
As always, we structure portfolios to be prepared for a wide range of potential outcomes. It is cliché to say that we expect volatility in the months to come, but aside from the fall of 2023, US equity markets have been unusually calm for the last year and a half. Regardless, Warren Buffett’s steadfast optimism in regard to the long-term prospects of America serves as a great reminder regarding the mentality of a successful long-term investor, especially when short-term discomfort inevitably arises.
Sincerely,
Brian Gift, CFA
Chief Investment Officer
MBL Advisors
Bob Farrell is a legendary Merrill Lynch strategist who published his timeless list of 10 investing rules several decades ago, a version of which can be found here https://www.investopedia.com/articles/fundamental-analysis/09/market-investor-axioms.asp. It seemed some investors believed these rules were no longer as relevant as they once were when they didn’t hold true to form during the extremely abnormal bear market and subsequent recovery in 2020 and 2021. However, all of these rules seem especially pertinent today as we proceed thorough this more traditional bear market. We have written about Bob Farrell’s rules on multiple occasions in the past. But their timelessness and truth always amaze us each time we observe them.
This content was prepared by MBL Advisors and reflects the current opinion of the firm, which may change without further notice. This report is for informational purposes only and is not intended to replace the advice of a qualified professional. Nothing contained herein should be considered as investment advice or a recommendation or solicitation for the purchase or sale of any security or other investment. Opinions contained herein should not be interpreted as a forecast of future events or a guarantee of future results. Different types of investments involve varying degrees of risk, and there can be no assurance that any specific investment will either be suitable or profitable for a client’s portfolio. Economic factors, market conditions, and investment strategies will affect the performance of any portfolio and there are no assurances that it will match or outperform any particular benchmark. Commentary regarding the returns for investment indices and categories do not reflect the performance of MBL Advisors or its clients. Historical performance results for investment indices and/or categories generally do not reflect the deduction of transaction and/or custodial charges or the deduction of an investment-management fee, the incurrence of which would have the effect of decreasing historical performance results. Investors cannot invest directly in an index.
The indices referenced herein have been selected because they are well known, easily recognized by investors, and reflect those indices that the firm believes, in part based on industry practice, provide a suitable benchmark against which to evaluate the investment or broader market described herein. Although certain information has been obtained from sources believed to be reliable, we do not guarantee its accuracy, completeness, or fairness. We have relied upon and assumed without independent verification, the accuracy and completeness of all information available from public sources.
This material is provided for informational purposes only. It is not an offer or solicitation to buy or sell any securities. Past performance does not guarantee future results, which may vary. The value of investments and the income derived from investments will fluctuate and can go down as well as up. A loss of principal may occur.
MBL Advisors Inc. is independently owned and operated. Investment Advisory Services are offered through MBL Wealth, LLC, a Registered Investment Advisor. Securities are offered through M Holdings Securities, Inc., a registered broker/dealer, member FINRA/SIPC. 7592033.1
Brian Gift, CFA — Chief Investment Officer — MBL Advisors
The Four Most Dangerous Words in Investing: It’s Different This Time
Equity market positioning and flows were both approaching aggressive extremes of historical ranges according to multiple gauges (sources: BofA Research Michael Hartnett; St. Louis Federal Reserve; NIAAM & Strategas Research Partners). Put/Call ratios were complacent as were put-call skews in options markets. AAII & II investor surveys remain bullish (contrarian bearish), although we are beginning to see signs of data moderating this week. In addition, there were three extremely crowded trades across capital markets before this recent correction, which could take more time to properly unwind:
When studying the history of the stock market one will quickly realize that there is rarely a “normal” environment. Rather, each market cycle has its own unique characteristics and narratives which define it and are often more obvious in hindsight. High / low inflation, high / low interest rates, geopolitics, high / low economic growth, especially accommodative / restrictive Fed policy, high / low tax regimes, large / small budget deficits, strong / weak currencies, etc. are all critical factors which influence markets over short to intermediate time frames. Regardless, of these regimes, the S&P 500 has compounded at roughly 9% +/- per year on average over the last 100 years. Sir John Templeton is famous for saying that “the four most dangerous words in investing are ‘it’s different this time.’” Nonetheless, the post-COVID environment seems unique both from an investment and economic perspective. Shutting down the economy, then dumping unfathomable amounts of fiscal and monetary stimulus into the economy and financial system, clearly produced unintended consequences, namely inflation and the “normalization” of very large debts / deficits. Unprecedented economic circumstances likely helped to accelerate some shifts in capital market dynamics over the past few years. Markets seem to move more quickly than ever as an increasing number of investors are willing to make bets with their capital for reasons other than what would be found in the Buffett / Graham investing principles playbook. The most notorious example of this is how the reddit meme stock traders began to target relatively less liquid stocks with high levels of short interest. Gabe Plotkin is one of the new owners of the Charlotte Hornets. But not long ago he ran one of the largest and most successful hedge funds on Wall Street, Melvin Capital. It is estimated that Melvin Capital lost roughly $7 Billion on their short position in GameStop stock (the Meme stock traders’ largest success). Melvin Capital was down roughly -39% in 2021 (a very good year for the stock market) and subsequently wound down its operations. This remains a truly an unfathomable event, even in hindsight. Another unique feature of the current market is how some large equity indices have become more concentrated among the heaviest weightings relative to any other point in the last 60+ years. The “Magnificent 7” stocks have effectively become their own asset class, as those 7 stocks now make up more than 30% of the S&P 500’s market capitalization and account for more than 20% of the S&P 500’s earnings. Good, bad or indifferent, these 7 stocks march to their own beat, both from a performance perspective (often uncorrelated to what the rest of the market is doing) and from a fundamental perspective (they have figured out how to grow the earnings almost regardless of the strength of the economy). Having said this, market dynamics of the “Mag 7” versus the rest of the market were becoming increasingly out of proportion at the end of the second quarter. We would even go as far to say that we were witnessing some occasional meme stock “like” behavior in some of the Mag 7 stocks, which could be observed by $2T – $3T market cap stocks moving 5% +/- in a single day, often on no real detectable news. Nvidia has been the poster child for the spectacular earnings growth driven by AI spending over the last year and a half. It has been nothing short of incredible to witness one of the largest stocks in the world grow earnings by 100%+ in a single year. At the same time, day to day market fluctuations of Nvidia’s stock have become increasingly bizarre throughout the recent months. Nvidia announced their Q1 earnings in mid May of this year, and it was a “hall of fame” earnings report, as all of their earnings announcements have been for the last five quarters . But the most amazing thing about the May earnings report was the ensuing performance of Nvidia’s stock in the weeks to come. Nvidia added over $1T in market cap during the month following this report (from mid May to mid June). For perspective, there are only six companies in the world (Mag 7 ex Tesla) who have a market cap over $1T. Notably, Berkshire Hathaway, the company that the “greatest investor of all time” has spent the last 60 years building, is not included in the list of businesses worth in excess of $1T.
The first half of 2024 was strong for global risk assets as many investors believed in the “goldilocks” narrative for the markets. US economic growth was strong, inflation continued to make progress lower, and there was an unquenchable thirst for “AI” related stocks, which seemed to go up every single day, regardless of the macro or micro news flow. The July CPI release was a day that all investors were eagerly awaiting, as it was believed that an inline / cool number would set the stage for the Fed to begin cutting rates at their September meeting. The July CPI figure was everything investors wanted and then some, but the follow-on reaction from the stock market has been anything but. Risk appetites seemed to change that day as we saw the first of many crowded trades begin to unwind. For the three weeks following, US small cap equities were the best performing asset class, and their relative outperformance was jumpstarted on the day of the CPI release, when they outperformed the NASDAQ by 5.5% on that single day. The importance of recalling this day is because it was our first glance of a crowded trade beginning to unwind. It seems that being long “high quality” in the form of secular growth stocks (i.e Mega cap tech), and short “low quality” in the form of small cap stocks was an extremely consensus trade among some institutional investors (i.e. hedge funds). This rotation continued within markets until late last week when we experienced the seemingly toxic combination of the Fed holding rates steady at their July meeting while they “wait for more data” (Wednesday), weak manufacturing data and a spike in jobless claims (Thursday), and a payroll report well below expectations on Friday. This sparked a traditional “risk off” move where all stocks and commodities (excluding gold) were sold off in equal proportions, while safe haven assets (high quality bonds) were bought heavily as interest rates plummeted. In a matter of days, narratives went from “goldilocks” to a Fed policy mistake and recession scare. Little did we know, last week was only the appetizer for what awaited global equity markets on Monday 8/5.
US equity futures traded down sharply on Sunday night as the Asian markets opened for trading on Monday 8/5. Japan was the center of attention, as their local equity markets declined by 12% – 13% that single day, due to a massive carry trade unwind. Various strategists had been noting for several weeks that short yen positioning was historically extreme, but few investors would have imagined that we would witness such a violent unraveling of this trade in a single day. Most central banks around the world began to raise interest rates in 2022 when they realized that inflation was becoming a serious issue for the global economy. However, after decades of deflation, the Bank of Japan kept their interest rates pinned around 0% in a continued effort to “reflate” their local economy. As central bank policies / interest rates began to diverge between Japan and the rest of the developed world, the Japanese Yen started to meaningfully depreciate against most other global currencies, including gold. This was the capital markets’ way of showing Japanese policy makers that there will be unintended consequences to massively suppressing interest rates. During this time, the Bank of Japan served as an endless buyer of Japanese Government bonds, in order to keep 10-year JGB yields below their stated 0.25% cap. Although the Bank of Japan was “successful” in controlling their interest rates, the consequence was that their currency was the release valve and was torched in the years to come. The Japanese Yen went from roughly 100 Yen / 1 USD in March of 2022 to around 160 Yen / 1 USD in July 2024. Large institutional investors are global players and have the sophistication to access any capital market in the world. Despite the “price of money” rapidly increasing in most currencies over the last few years, investors can still borrow Yen for close to 0%, thanks to the Bank of Japan’s extremely easy interest rate policy. Human beings always follow incentives, and thus unsurprisingly, global investors have been borrowing money from the cheapest source of capital that exists (Japan). If “free money” were not enough, investors were further rewarded by this trade when they effectively “sold” the Yen that they borrowed, and in turn bought short term government bonds in another currency. This trade was beneficial to investors in two ways. First, there was an endless supply of high-quality government bonds around the world which offered a positive “carry” relative to the investors borrowing costs. Second, most currencies have been appreciating vs. the Yen for the last few years, and this only magnified the profitability of this carry trade. However, the ultimate payoff of the Yen carry trade came to investors who bought US tech stocks (or other risk assets instead of government bonds) over the last couple of years. Shorting the Yen (on margin) to purchase US tech stocks was likely one of the greatest carry trades of all time while it lasted.
The fundamental catalyst for the unwind of this carry trade, is that the depreciation of the Japanese Yen finally reached a pain point for Japanese policy makers. Thus, the Bank of Japan began to pivot their policy stance in an effort to prioritize defending their currency. Although Japan is an export heavy economy (export economies typically like a slightly weaker currency), they import most of their energy sources (oil & natural gas) which are priced in US dollars. In other words, imports, most importantly energy sources, were becoming more expensive for the Japanese as their currency continued to depreciate. This likely became a point of legitimate pain, for Japanese citizens and businesses alike, as inflation was being imported from the rest of the world to them, serving as a tax on the economy. Over the last couple of months, the Bank of Japan has directly intervened (buying Yen: selling US dollars) in currency markets in an attempt to stop the deprecation of their currency. On numerous occasions this was only effective for a couple of days at a time, until the prevailing trend of a weaker Yen resumed. But late last week, the Bank of Japan instituted a surprise interest rate hike (just as most other central banks are beginning to cut rates) and stated that “a weak currency is a reason to tighten monetary policy.” This ignited a spark in global currency markets as the Yen began to rapidly appreciate against most other currencies. Monday August 5th was the day that the newfound Yen strength became an issue for global markets, and likely caused various investors (including Japanese citizens who were hedging against an endlessly weaker currency) to unwind a portion their carry trades consisting of short yen / long other assets (Japan stocks, US tech stocks, etc.). For highly levered players, this likely caused some forced selling / margin calls. This is likely more than many of you wanted to know about the Yen carry trade, but it sets the stage for us to attempt to think about where we go from here. As of Monday 8/5, the S&P 500 was down roughly -9% from its all-time highs from 7/16/24. Roughly 1/3 of this decline happened as US tech stocks sold off while virtually all other areas of the US equity market performed very well (but the S&P 500 is close to 50% technology related stocks now). Roughly 1/3 of this selloff occurred around the newfound growth scare / potential policy mistake by the Fed late last week. And the final 1/3 of this correction was very mechanical in nature, occurring in a single day, due to the unwinding of the Yen carry trade. Thus far, we continue to view this as a healthy and overdue correction within the context of a bull market. Corporate earnings expectations for 2024 & 2025 remain firm, and as always, will be the most important factor for equity market returns in the months and years to come.
Prior to the recent rotation out of mega cap tech names, the S&P 500 Index was more concentrated in the top 5 names than it has been at any other point in the last 60+ years. The top five names in the index (AAPL, MSFT, NVDA, GOOG & AMZN) accounted for approximately 29% of the market cap of the S&P 500. This contrasts with the top five names accounting for less than 11% of the S&P 500’s index weight at the secular lows in 1993 & 2010.
Source: @SmartReversals & Bianco Research
Excluding the last month, the historically high index concentration among the top five (29%+/-) and top ten (39% +/-) names has been an incredibly friendly dynamic to investors for the last year and half. The S&P 500 has produced very strong returns in 2023 & 2024 despite a historically low percentage of stocks achieving returns above the index returns.
Source: NDR Research & @edclissold
There have been two distinct time frames where the largest stocks have sustainably outperformed the rest of the index. These instances occurred in the late 1990’s and 2017 – 2024. As a group, the bottom 493 stocks in the S&P 500 have tended to outperform the top 7 names in the S&P 500 during other time frames over the last 50 years.
Source: NDR Research & @edclissold
A plethora of market prognosticators have mentioned how the Mag 7 stocks seem to have both offensive and defensive characteristics to them. On one hand, investors are betting that they will be some of the primary beneficiaries from the AI industrial revolution of which we are likely in the early stages. At the same time, these stocks also have fortress balance sheets (ex TSLA) and have also been the best secular growth stories in the market for ten years and running, regardless of the strength of the economy. It is difficult to debate the above facts. The biggest question investors must grapple with right now, is “how much good news” is already priced into these stocks? In mid-July, the Technology sector was trading at its highest PE ratio on record, outside of the tech bubble. These valuations will not be sustainable if profit margins begin to compress for technology stocks.
Source: Charles Schwab, @KevRGordon & Bloomberg
In their quarterly letter at the end of June, Akre Capital offered some fascinating perspective regarding part of the reason as to why it becomes difficult for the largest companies to continue to outperform indefinitely. “The S&P 500 currently boasts three companies with market capitalizations of $3 trillion or more: Apple ($3.3T), MSFT ($3.4T) and NVDA ($3.1T). The monetary value of all “final” goods and services produced by the United States – a.k.a. Gross Domestic Product or “GDP” – was $27.4 trillion in 2023. In other words, these $3 trillion+ market cap companies are currently valued at approximately 12% of GDP – each. Assume that investors in these three companies expect their market capitalizations to compound at 15% annually over the next decade. Assume US GDP growth of 3% annually over the same period. Satisfying these conditions would require the respective market capitalizations of Apple, Microsoft, and Nvidia to grow from nearly 12% of GDP today to nearly 36% of GDP by 2034. Combined, the value of these three businesses would then equate to 107% of US GDP. The sheer size of these numbers suggests to us that this outcome is unlikely. The value of any group of businesses bears some relationship to the size of the economy in which they operate. For publicly traded businesses, that relationship is called the ‘Buffett Indicator.’”
Source: Akre Capital & 22V Research
Strategas Research Partners Don Rissmiller 8/4/24 Bottom line: There’s a case the Fed should have already cut rates, but we don’t want to jump to the panic of a recession/crisis. It’s early, but the Atlanta Fed’s tracking estimate for U.S. real GDP in 3Q is running at an acceptable +2.5% q/q A.R. Productivity (which was a solid +2.3% q/q A.R. in 2Q) has been helping support growth. We believe the Fed is set to follow what other central banks are doing (eg, the Bank of England last week) and move toward a more neutral monetary policy. In anticipation, relief for interest rate sensitive sectors like housing & mfg is already starting given the rally in the bond market (the 10-year Treasury finished last week at 3.8%). Notably, U.S. pending home sales rose +4.8% m/m in July. Such rate relief & pent-up home sales should help keep the small cracks in the economy from turning into big cracks now.
Multiple “flawless” recession indicators have triggered over the past few years, including inverted yield curves, negative US Leading Economic Indicators, Manufacturing gages in negative territory, etc. These indicators caused many investors to believe the 2022 bear market was a precursor to an inevitable recession. This of course did not occur, and if / when a recession happens, it will be accompanied by its own, separate bear market. Thus, the 2022 bear market was an inflation scare, where an ensuing recession did not immediately happen. Somewhat ironically, US Real GDP has been strong, and has grown at (2%) trend growth or above for the last 6 quarters. Having said this, we are now at a point where economic growth is clearly slowing; the question is how much and how fast?
22V Research Dennis DeBusschere 8/4/24 We think the economic data will stabilize, and recession risk remains low – less low than last week, but still low. But, it won’t pay to try and monetize that view by leaning into Cyclical economic sectors and shorting Defensive and Low Vol for at least a few more weeks. In the meantime, expect a violently flat market backdrop as the sharp de-grossing/short-term oversold condition is met with continued fears of a possible recession. The Fed is going to aggressively ease and be pro-growth going forward the question is if you believe that easing will have a positive impact on economic growth longer term. We think it will. If a negative feedback loop has already started, being long Defensives makes sense. We are fading that view. Goldman Sachs 8/4/24 The chances of a U.S. recession in the next 12 months have risen from 15% to 25%, a team of Goldman economists led by Jan Hatzius said on Sunday, flagging a July employment report that looked “weak across the board.” Apollo Torsten Slok 8/4/24 There are no signs of a slowdown in restaurant bookings, TSA air travel data, tax withholdings, retail sales, hotel demand, bank lending, Broadway show attendance, and weekly box office grosses. Combined with GDP in the second quarter coming in at 2.8%, the bottom line is that the current state of the economy can be described as slowing, but still a soft landing. KKR Henry McVey 8/6/24 This ‘bump’ is not the end of the cycle, and it reminds us whey we stick to our Rolling Recovery, Rolling Recession thesis versus the traditional synchronized global recovery. From a portfolio construction perspective, we continue to remain overweight diversification, including an emphasis on non –correlated assets. Overall, though, our view is that this shock will take some time for investors to re-assume a risk on posture. Therein lies the opportunity for patient capital.
Source: Strategas Research Partners, 22V Research, Goldman Sachs, Apollo & KKR
After a couple of years of obsessing over every piece of inflation data possible, the market will no longer be as sensitive to this data (barring any large upside surprises). Economic growth is now the primary concern for market participants. The good news is that the Fed is likely to aggressively pivot and become more sensitive to their “full employment” mandate, now that their “price stability” goals have largely been accomplished. The strong labor market has been the primary reason that the US economy avoided recession over the past few years. Weekly initial jobless claims are now the single most important high frequency economic data point. Last week’s reading of 250,000 remains low by historical standards. But this data tends to trend and the 260,000 – 300,000 area will be interpreted as a warning sign for the economy.
Source: MBL Advisors & FactSet
Capital Markets often have a faster and more accurate interpretation of the current investment environment than investors / strategists / economists. In this regard, the bond market is once again screaming at the Fed that they are behind the curve. This is the precise situation that occurred in the fall of 2021 when 2-year US Treasury yields started to accelerate to the upside while the Fed held rates steady at 0% and continued to conduct QE. The bond market was telling the Fed that they had a major issue with inflation, while the Fed stuck to their “transitory” thesis.
The only difference today is that yields are moving lower instead of higher, but we are back to a point where the spread between 2-year US Treasury yields, and the Fed Funds rate is historically wide.
The bond market’s message to the Fed is that they are once again behind the curve, as their policy rate is far too restrictive given the slowing growth dynamics in the economy.
Source: MBL Advisors & FactSet
The stock market’s “opinion” of the economy is certainly less optimistic than it was a couple of months ago. One of the more troubling aspects of this correction is the reality that consumer discretionary stocks are breaking down relative to the consumer staples sector, along with the broad market. This is a notable tone change relative to the last year and a half. In addition, credit spreads have begun to moderately widen, albeit from very tight levels.
Finally, most commodities outside of gold are not acting well, possibly signifying lower economic growth and inflation expectations.
These risk barometers will be important to watch in the months to come. Even in an optimistic scenario, they could be signaling that we are in more of a “late cycle” environment moving forward.
Source: MBL Advisors & FactSet
US equity markets were statistically overbought and expensive with sentiment and positioning extremely bullish before this correction started. In this regard, the recent selloff is extremely healthy thus far. Savita Subramanian noted several important statistics in her note titled “Hello Volatility” on 8/5/24.
Source: BofA Global Research & Strategas Research Partners
The S&P 500 remains above its upward sloping 200 day moving average, although an eventual test of this moving average will be inevitable at some point. When the S&P 500 (or any security / index) trades below its 200-day moving average, this does not necessarily mean a bear market will occur. But the bulk of the declines during major bear markets (outside of true black swan events like COVID) occur when an asset is trading below its downward sloping 200 day moving average. Fighting against prevailing trends is usually not a rewarding strategy for longer term investors.
Source: MBL Advisors & FactSet
The VIX briefly spiked to 65 on Monday morning, a level that has rarely been registered over the last 35 years. Forward Returns tend to be strong following a spike in volatility, measured by the VIX. On average, 6-month forward returns are +11.9% and are positive 81% of observations. The VIX curve is also inverted which tends to be another good contrarian buy signal. Conversely, most other oversold indicators have not yet triggered. Two opposing things are often true at the same time in this business. 6-month forward returns could be solid from these levels, despite this correction possibly needing more time to run its course, according to a plethora of other indicators. We will have more conviction that we are closer to a bottom when we begin to see a higher percentage of indicators trigger. Some of these indicators include the following:
Source: Strategas Research Partners
S&P 500 Year-over-Year earnings growth is around +11% as we approach the end of Q2 earnings season. This is clearly very respectable, and earnings growth estimates for the next several quarters remain firm. This is in stark contrast to the last year when Mag 7 companies were the only businesses who were able to grow earnings, and did so at an unbelievable clip, largely thanks to AI. A broadening out of earnings growth beyond Mega cap tech would be an extremely welcomed event for most investors. Nvidia earnings announcements have become of the most important data points for the entire market each quarter. They report Q2 earnings after the market close on 8/28.
Source: Strategas Research Partners
In summary, we are in the throes of what could be a very typical 10% – 15% correction associated with a mid-cycle slowdown. According to JP Morgan, the average peakto-trough correction since 1980 is roughly -14% (and this is skewed to the downside by some big down years such as 2008). Media outlets will explain this correction with various narratives such as a growth scare, a Fed policy mistake, the carry trade unwind, etc. All of these story lines have plenty of truth to them, but we simply believe that this market was long overdue for something more than a 4% – 5% correction, in order to flush out some of the excesses which had been building up for months. Resetting sentiment (not there yet), positioning (not there yet) and valuations (not there yet) should ultimately be healthy for extending the durability of this bull market. If we can get through this seasonally weak period for markets without too much further technical damage being done to the tape, a traditionally stronger seasonal period may await us after the election. Both in markets and in “life” more broadly, we seem to have normalized the traditionally abnormal in countless ways over the last several years. Some of the “abnormal” things which we have “normalized” include the following:
It might take a very long time for the situation in Washington D.C. to resemble normalcy. But it seems as though we are on the right path in the economy. Interest rates should settle out at more “normal” levels, which we haven’t seen since prior to 2008. Inflation will likely maintain a level in excess of the Fed’s stated 2% target, but this comes after a more than a decade of consistently undershooting that target due to deflationary pressures which persisted from the financial crisis. An economy that grows around 2% in real terms and 5% in nominal terms should be a solid environment for corporate profits. This correction could be a catalyst that returns capital markets back to a more well-balanced state of being. This would include interest rates that settle out in the 3% – 4% range, inflation in the 2% – 3% range, equity markets which produce 8% – 10% annualized returns on average, and have more broad participation beyond Mega cap tech stocks, equity market PE multiples become more palatable at something less than 20x forward earnings, winners and losers are driven by fundamentals rather than strictly if a business “has” AI or “not.” To be clear, we would not bet against the Mega Cap Tech stocks, and they consist of meaningful positions in our portfolios. Rather, we simply believe it would be emblematic of a healthy market for there to be more than one game in town. There will undoubtedly be endless surprises that come our way, as is always the case with investing. Diversification is “admitting” that we don’t “have” all the “answers” and therefore, need to be prepared for a wide range of outcomes. We look forward to discussing this with you in more detail over the days and weeks ahead.
Sincerely,
Brian Gift, CFA
Chief Investment Officer
MBL Advisors
Bob Farrell is a legendary Merrill Lynch strategist who published his timeless list of 10 investing rules several decades ago, a version of which can be found here: https://www.investopedia.com/articles/fundamental-analysis/09/market-investor-axioms.asp. We have written about Bob Farrell’s rules on multiple occasions in the past. Nonetheless, the simple brilliance of these rules always amazes us each time we observe them. They seem to be especially useful in this current environment!
This content was prepared by MBL Advisors and reflects the current opinion of the firm, which may change without further notice. This report is for informational purposes only and is not intended to replace the advice of a qualified professional. Nothing contained herein should be considered as investment advice or a recommendation or solicitation for the purchase or sale of any security or other investment. Opinions contained herein should not be interpreted as a forecast of future events or a guarantee of future results. Different types of investments involve varying degrees of risk, and there can be no assurance that any specific investment will either be suitable or profitable for a client’s portfolio. Economic factors, market conditions, and investment strategies will affect the performance of any portfolio and there are no assurances that it will match or outperform any particular benchmark. Commentary regarding the returns for investment indices and categories do not reflect the performance of MBL Advisors or its clients. Historical performance results for investment indices and/or categories generally do not reflect the deduction of transaction and/or custodial charges or the deduction of an investment-management fee, the incurrence of which would have the effect of decreasing historical performance results. Investors cannot invest directly in an index.
The indices referenced herein have been selected because they are well known, easily recognized by investors, and reflect those indices that the firm believes, in part based on industry practice, provide a suitable benchmark against which to evaluate the investment or broader market described herein. Although certain information has been obtained from sources believed to be reliable, we do not guarantee its accuracy, completeness, or fairness. We have relied upon and assumed without independent verification, the accuracy and completeness of all information available from public sources.
This material is provided for informational purposes only. It is not an offer or solicitation to buy or sell any securities. Past performance does not guarantee future results, which may vary. The value of investments and the income derived from investments will fluctuate and can go down as well as up. A loss of principal may occur.
MBL Advisors Inc. is independently owned and operated. Investment Advisory Services are offered through MBL Wealth, LLC, a Registered Investment Advisor. Securities are offered through M Holdings Securities, Inc., a registered broker/dealer, member FINRA/SIPC. 6878005.1.
Brian Gift, CFA — Chief Investment Officer — MBL Advisors
In theory, the turn in a calendar year should have no impact on market trends or leadership, yet it always amazes us how each year develops its own unique characteristics and storylines. Since COVID, the investment landscape has been unique. Various aspects of the economy seem as desynchronized as they have been at any point in modern times. We experienced the fastest stock market crash from all-time highs in history during March 2020, followed by one of the most violent bull markets ever, in part thanks to the unprecedented monetary and fiscal stimulus that was dumped into the global economy. As always, there were unintended consequences to policy makers’ outsized actions, namely a global asset bubble in 2021 followed by the highest inflation readings the developed world has experienced in over 40 years. 2022 was not a pleasant year for investors, as various asset bubbles deflated with central banks declaring war against inflation. Nevertheless, as we begin 2024, the 2022 bear market seems to have been “healthy” in many regards, as the true bubbles have collapsed (NFT’s, most crypto, Meme stocks, companies with no line of sight to profitability, long duration bonds, etc.), and central banks seem to have regained control of their price stability mandate.
To the surprise of many, the 2022 bear market stopped short of anything more dire, ultimately leading to solid gains across most asset classes in 2023. Aside from Mega Cap Technology stocks, effectively all of the gains came in the final two months of the year, as capital markets quickly changed their tone and priced in an all elusive economic “soft landing.”
In our recent conversations with clients, we have noted that this has been a particularly difficult investment environment around which to gain high levels of conviction. If one thing seems for certain, it is that public markets are now capable of moving more quickly than ever, as an increasingly large amount of volume is conducted by algorithmic, systematic, short-term traders, who pay very little attention to traditional fundamental investment approaches. Goldman Sachs noted that at the beginning of November, CTA’s had the highest levels of short positioning in US equities since 2011, which undoubtedly provided a lot of fuel to the equity rally to close out the year.
One factor that has affected all investors alike over the last few years has been the extreme volatility in interest rates. Even relatively “low risk” assets such as short to intermediate government bonds have exhibited levels of volatility which are historically rare over the last couple of years. Price movements in intermediate government bonds could be confused with small cap stocks recently, which has filtered through to the relatively sharp price movements across all asset classes. Long duration treasury bonds are inherently volatile, but at one-point last year their price decline from their peak (in 2020) was larger than the peak to trough decline in the S&P 500 from October 2007 – March 2009 (which was the worst equity bear market since the 1930’s). With the worst of the inflation battle seemingly behind us, we are hopeful that lower volatility in interest rates will lead to a more stable investment environment in the years ahead.
In the pages to follow we have outlined several observations that we believe will be useful in helping investors avoid some potential “blind spots” in the months ahead. To be clear, the “crosswinds” appear as extreme as ever, with no shortage of items for the “bulls” or “bears” to hang their hats on. With myriad contradictory factors in play, and markets immediately pricing in new information, our primary advantage will remain in extending our time horizon well beyond the short-term noise and narrative of the day. Investors always need to be prepared for a wide range of outcomes over shorter term time horizons, and we believe this is especially imperative for the year ahead.
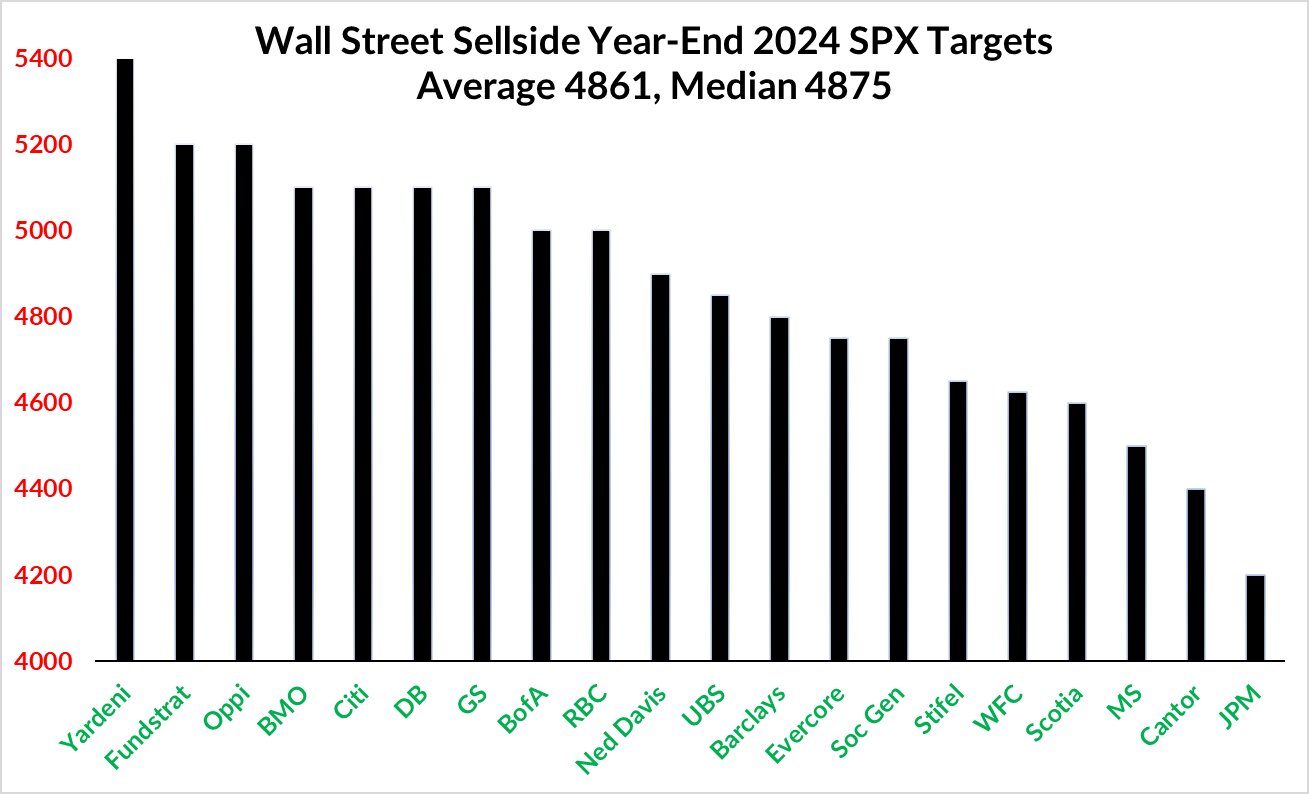
Source: Tom Lee & FSInsights
Much of Wall Street seemed to be regaining a relatively bullish tone in their 2024 outlooks when they were published in late November and early December. However, given the strong rally in equity markets to finish the year, the average strategist price target is forecasting very muted upside for US Large Cap equities in 2024. Goldman Sachs already (on December 18th) revised their original 2024 S&P 500 price target (set in November 2023) from 4700 up to 5100. Could there be more to follow? When Wall Street is cautious, it is often bullish for equity markets.
As a reminder, strategists were the most bearish they had ever been entering 2023. It was the only time in the last 25 years when the average strategist forecast was for negative returns for the S&P 500. Wall Street’s forecasts from a year ago serve as a great reminder that “predicting the future” is very difficult.
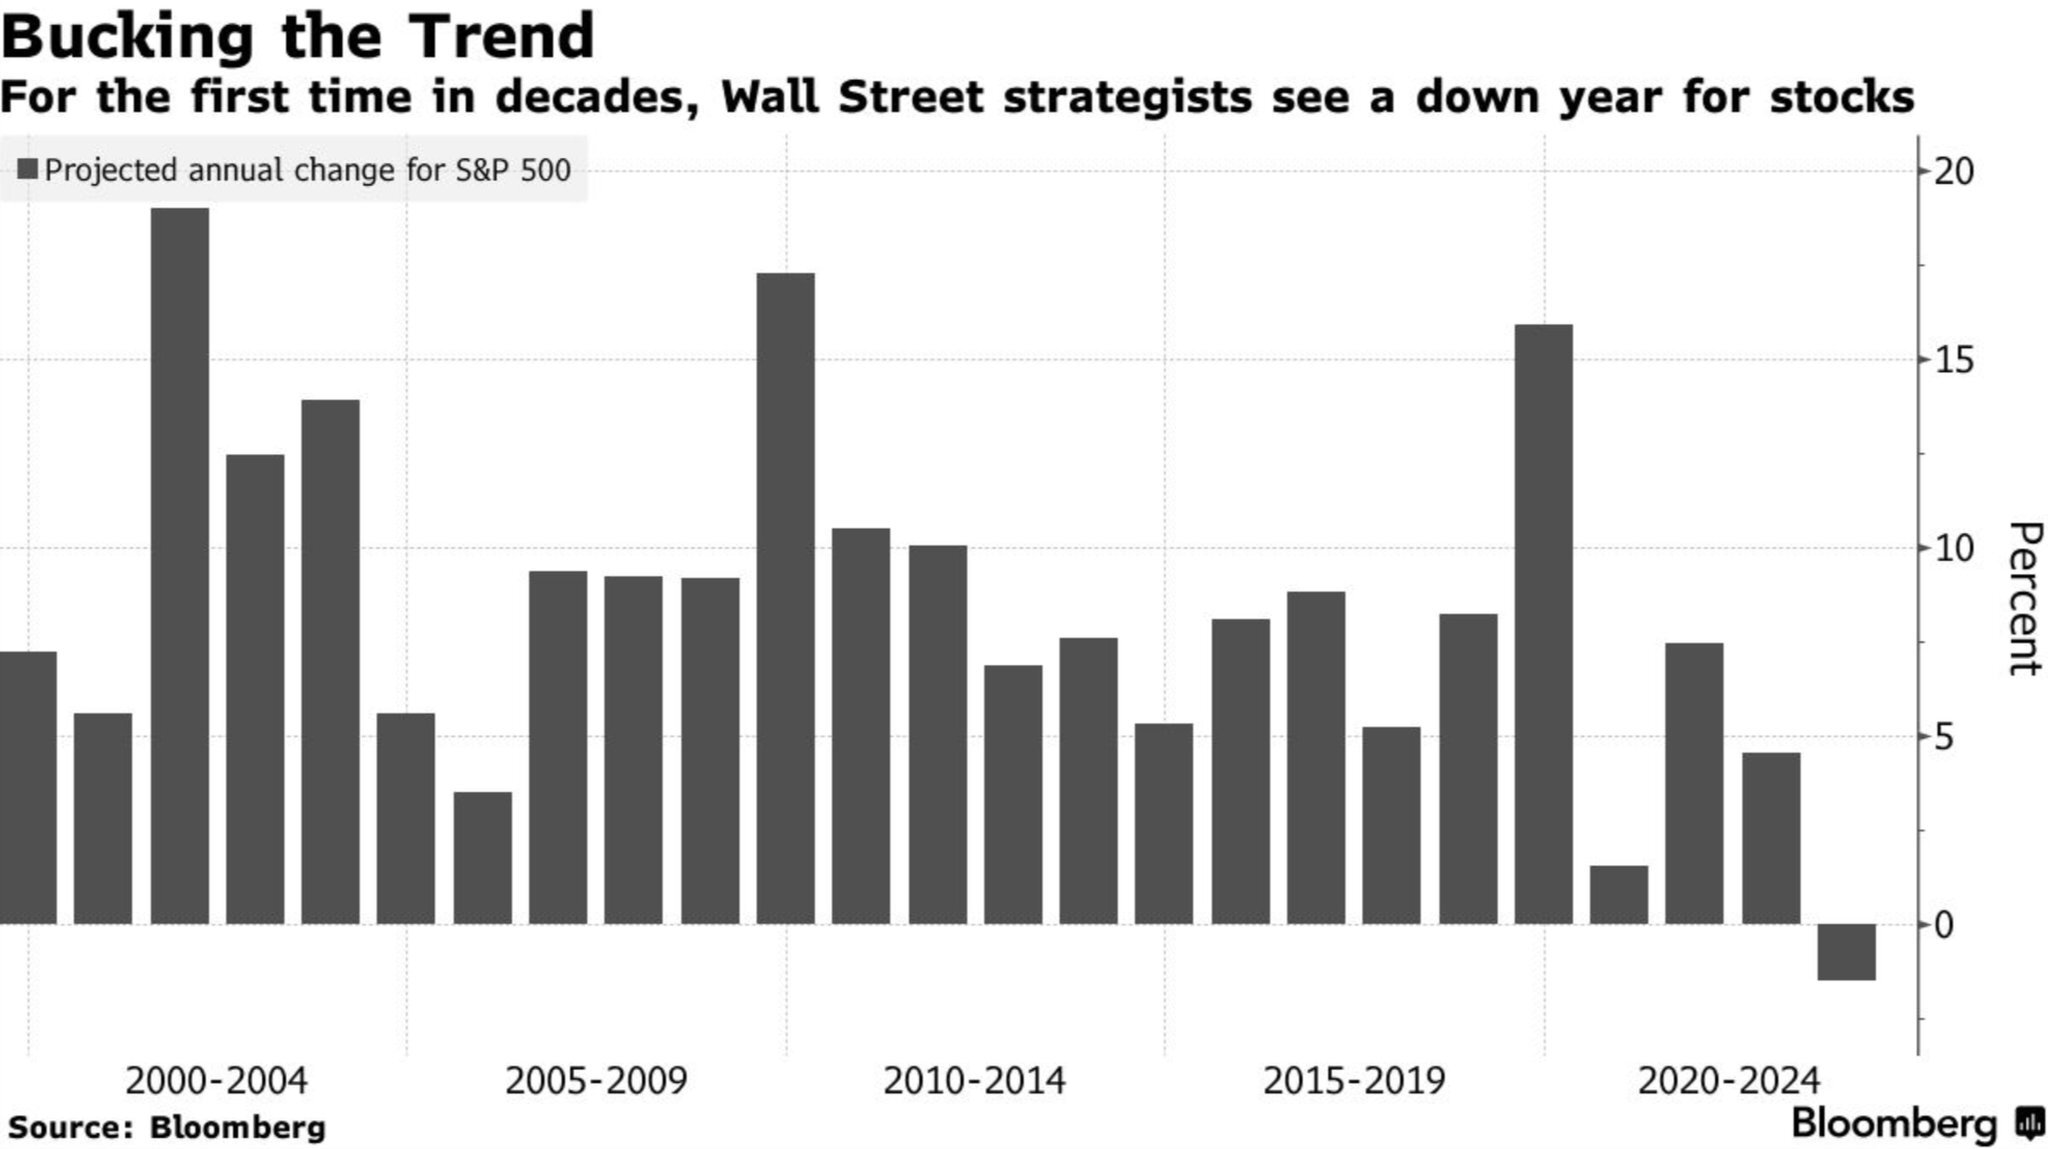
Source: Bloomberg.com
Dr. David Kelly from JP Morgan utilized a terrific investment analogy in his recent newsletter from 12/11/23 (Source: Dr. David Kelly: The Investment Climate). He wrote:
As winter weather envelops the homes of New England, our thoughts naturally turn to warmer days and maybe a beach house on Cape Cod. Of course, if you intend to rent such a house for a week next summer, it’s pretty much a roll of the dice. You could get lovely weather, or it could rain every day. However, if you plan to buy a beach house on Cape Cod, you really only need to understand the climate. The sunny summer days will far outnumber the wet ones.
Long term investing is like Buying, rather than renting, a beach house. The important thing is to understand the climate rather than to forecast the weather. Every December, market strategists publish their forecasts for the S&P500 for the end of the following year. Some are bullish and some are bearish. However, if we are being honest, it’s an almost impossible task. The logical construction of a year-end 2024 estimate would require an accurate short-term forecast of growth, inflation and the dollar, how these variables could impact profits and interest rates, how policy makers might respond to markets and other forces and, most importantly, how unforeseeable but inevitable shocks would impact investor sentiment and flows. Getting this right over a one-year time horizon is next to impossible.
Dr. Kelly’s words are far simpler and more elegant than anything we could produce originally. But it is a perfect narrative for how we have been describing the investment landscape for the next five plus years.
Since COVID, we are not aware of many economists who have consistently had a good pulse on the business cycle. A year ago, 85% of economists believed that a global recession was inevitable in 2023 (source: Financial Times & Ben Carlson, CFA). Despite not having this recession yet, the consensus now believes the Fed will pull off an all elusive “soft landing.” The December 2023 Bank of America Global Fund Manager Survey confirmed that the consensus is officially in the soft-landing camp – “with over 70% of participants now expecting a “soft” or “no” landing in 2024″ (source: Michael Hartnett & BofA Global Research).
Whether the global economy experiences a recession or not will likely have a substantial impact on the performance of most asset classes in 2024. At the same time, a recession unfolding or not in 2024 may have little impact on 5 year returns for most broad asset classes, aside from the sequencing of these eventual returns.
A multitude of research analysts, including Savita Subramanian from BofA Research, have written extensively to demonstrate that starting equity valuations are by far the best predictor of long-term equity market returns. This doesn’t mean they are perfect, and over shorter-term time horizons equity valuations are a useless metric for forecasting returns. But when we shift our focus beyond 2024 in isolation and think about what five-year returns might look like, we find the setup to be fairly encouraging.
| Index | NTM PE | LT Average | LT Average Horizon | Source | Date |
|---|---|---|---|---|---|
| S&P 500 | 19.5x | 15.96x | Since 2002 | MBL Advisors & FactSet | 12/31/2023 |
| S&P 500 10 Largest Stocks | 25.4x | 19.1x | Since 1990 | BMO Capital Markets ISG | 12/7/2023 |
| S&P 500 Ex 10 Largest Stocks | 15.4x | 15.9x | Since 1990 | BMO Capital Markets ISG | 12/7/2023 |
| S&P Mid Cap 400 | 14.5x | 14.19x | Since 2002 | MBL Advisors & FactSet | 12/31/2023 |
| S&P Small Cap 600 | 14.3x | 14.59x | Since 2002 | MBL Advisors & FactSet | 12/31/2023 |
| MSCI ACWI ex US | 13.1x | 12.9x | Since 2003 | JPM Guide to the Markets | 12/31/2023 |
| 10 Year Treasury Yield | 3.88% | 3.03% | Since 2002 | MBL Advisors & FactSet | 12/31/2023 |
Most equity indices, aside from the market cap weighted S&P 500, are priced in line with long-term historical averages, which could provide investors with (average) high single digit annualized returns over the next 5 to 10 years. Despite the recent rally in bond prices, bond yields generally remain more attractive than they have been at any other point over the last 15 years. In addition, JC Parents from All Star Charts, has been pounding the table to bring attention to the reality that countless (non-US) global stock market indices have recently made new 52-week highs (many of which are new all-time highs). For US investors allocating capital outside of the US, the strong US dollar has been a headwind to these returns. However, the US dollar has begun to weaken against many currencies in the last couple of months, notably against several emerging market countries. This could serve as a tailwind to non-US equities in 2024 – although we recognize that strategists seem to have been incorrectly forecasting this dynamic for several years.
According to the Bank of America Global Fund Manager Survey, 2023 began with investors underweight equities relative to bonds, and this positioning only became more extreme as the year progressed. Last spring, investors were more underweight stocks vs. bonds than they were during the depths of the Great Financial Crisis in March 2009, according to the Global Fund Manager Survey. As of November 2023, investors moved back to a fractional overweight positioning of stocks vs. bonds, which was the first overweight reading since April 2022.
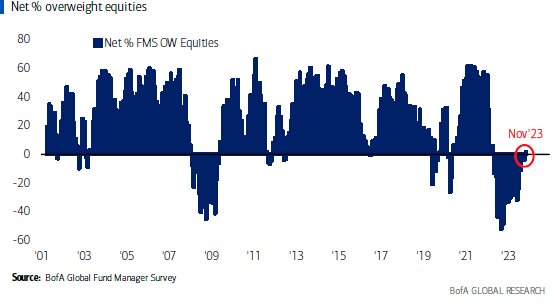
Investor sentiment is most useful when it is at an extreme, and sentiment was rapidly advancing into the direction of a bullish extreme (on some shorter-term metrics) to finish 2023. Chris Verrone from Strategas Research Partners frequently reminds us that “sentiment follows price in this business, not the other way around.” According to Strategas Research Partners, cumulative flows into US equities are extremely bullish (contrarian bearish) on a short-term basis. The 14-day RSI on the S&P 500 was at multi year highs to finish 2023, signaling extreme overbought levels. AAII % Bullish moved from 20% (end of 2022) to 53% (12/22/23). AAII % Bearish moved from 52% (end of 2022) to 21% (12/22/23). Goldman Sachs Sentiment Indicator suggests highly optimistic, “stretched” positioning. Dennis DeBusschere & 22V Research recently noted that “with the VIX sub 13, credit spreads in their 18th percentile (very tight), the S&P 500 PE over 19.5x, and investor sentiment (AAII) in its 98th percentile, the scope for further S&P gains is narrowing” (Source: MarketWatch: Inflation’s path will drive the stock market next year. Here’s one firm’s playbook). In other words, “yes” economic conditions seem to have improved relative to what was feared for most of 2023, but plenty of “good news” is now reflected across asset prices as well. Although some consolidation could be warranted during the first few months of 2024, this should not necessarily be conflated with the end of a bull market.
As is the case with most aspects of life, financial markets have no shortage of meaningful events to help characterize various time periods. With 2023 fresh in our minds, we could reflect on a plethora of details which were noteworthy over the last year. Nonetheless, when we look back on 2023 five years from now, we suspect there will be one theme which stands apart from the rest – the emergence of generative Artificial Intelligence.
Technologists are fairly uniform in believing that AI will be a game changer for society, especially with regards to productivity levels over the next 5-10 years.
For the stock market, it was the combination of Chat GPT and Nvidia’s May 2023 earnings report which catalyzed the “AI frenzy”, most notably observed by the ferocious rally in the “Magnificent 7.”
The utter dominance of these stocks caused Strategas Research Partners to construct a new “Mag 7” sector within the S&P 500. When removing these stocks from their traditional sectors allocations, the “Mag 7” sector is more than double the size of any other sector within the S&P 500. Good or bad alike, this has left previously “diversified” indices such as the S&P 500 or NASDAQ more concentrated than ever before.
Regardless of the past, investors are now left with the task of analyzing this new “Mag 7” asset class and its investment prospects moving forward. Of course, this is anything but a simple task. But at a minimum, investors need to acknowledge that there is no historical precedent for the dominance, incredible innovation, and overall greatness of these businesses. With the benefit of hindsight, we can think of these companies as modern-day monopolies who have no boundaries for the segments in the economy for which they will operate. Jeff Bezos once famously noted that “your (profit) margin is my opportunity.”
At the same time, no shortage of “good news” has been priced into these stocks, and it will be fascinating to observe if they can continue to beat what have become exceptionally lofty expectations.
S&P 500 earnings per share should be almost exactly flat for calendar year 2023, thus making the entirety of the stock market gains for last year attributable to multiple expansion (of course this is not necessarily true on a company-by-company basis, as NVDA actually became cheaper in 2023 despite its blockbuster gains). Stocks often move on “better” or “worse” news relative to expectations, rather than outright “good” or “bad” news itself. The amount of optimism prevalent in many of these stocks can be observed by the fact that the Magnificent 7 stocks account for 29% of the market cap weighted S&P 500 while only contributing 20% of S&P 500 Earnings.
| S&P 500 Sector Earnings Contribution & Market Cap Weight | ||||
|---|---|---|---|---|
| Sector | Trailing 12-Months Earnings Contribution | Next 12-Months Earnings Contribution | Market-Cap Weight | Difference Between NTM Contribution & Market-Cap Weight |
| FIN | 20.5% | 17.6% | 12.9% | 4.6% |
| ENE | 9.3% | 7.4% | 4.0% | 3.5% |
| HC | 11.9% | 14.1% | 12.7% | 1.4% |
| COMM | 3.4% | 3.4% | 2.9% | 0.6% |
| UTL | 2.5% | 2.9% | 2.4% | 0.5% |
| CD | 6.4% | 5.9% | 5.7% | 0.3% |
| IND | 9.2% | 8.6% | 8.4% | 0.2% |
| CS | 6.7% | 6.4% | 6.2% | 0.2% |
| MAT | 2.9% | 2.5% | 2.4% | 0.1% |
| RE | 1.4% | 1.3% | 2.5% | -1.2% |
| TECH | 6.7% | 9.4% | 11.4% | -2.1% |
| MAG 7 | 19.0% | 20.5% | 28.7% | -8.2% |
Source: Strategas Research Partners 12/11/23
As with Bitcoin in 2021, we do not pretend to understand all the dynamics of AI and how it will practically relate to American businesses in the years ahead. Having said this, our suspicion is that AI could be overhyped regarding its actual impact on productivity and profits for the next few quarters, but at the same time, massively underestimated when looking ahead to the end of this decade.
It is probably not an exaggeration to say that the “bulls” have been given nearly “everything” they could hope for given the way financial assets behaved in the final two months of 2023. These dynamics won’t last forever, but the US economy has been far more resilient than many economists imagined; inflation has come down meaningfully from a year ago; the Fed has completed its rate hiking cycle; the labor market remains on extremely solid footing; and most importantly, the message from the stock market is a very clear “risk on.”
Most broad global equity markets are now above their 200-day moving averages, many of which are upward sloping. Betting against strong market trends prior to much evidence of these trends changing rarely works out well for contrarian investors. In addition, market internals look exactly like they should during a bull market, with traditionally defensive sectors among the biggest laggards and numerous high beta areas leading the markets higher.
Most importantly, numerous “buy signals” have triggered over the last several months. Often, similar “buy signals” are produced within weeks / months following notable bear market bottoms, but this was not the case following the October 2022 bear market lows. The fact that these signals are now being generated is somewhat of a “game changer” for many investors, helping to contribute to the increasingly bullish tone in markets. Nearly everyone would acknowledge that equity markets have gone a long way in a very short amount of time recently. But these signals are almost never generated at the end of a bull market, and when looking forward 6-12 months, the various buy signals listed below should very clearly be interpreted as bullish.
| Signal | Date Triggered | Average 1 Year Forward Returns | % Positive Returns 1 Year Forward | Source |
|---|---|---|---|---|
| S&P 500 makes a new all-time high after more than 1 Year without one | Not Yet Triggered but very close | 14.90% | 92.9%: 13/14 Since 1950 | Ryan Detrick & Carson Investment Research |
| > 60% of S&P 500 hits a 20-day high | 12/14/2023 | 17.70% | 95.8%: 23/24 Since 1990 | Chris Verrone, Todd Sohn & Strategas Research Partners |
| CPI drops 5% from its peak | 6/30/2023 | 14.94% | 83.3%: 5/6 Since 1943 | Bespoke Invest |
| S&P 500 up 20% After a > -20% Bear Market | 6/9/2023 | 18.90% | 91.7%: 11/12 Since 1949 | Seth Golden |
| Zweig Breadth Thrust | 11/3/2023 | 23.30% | 100%: 16/16 Since 1945 | Ryan Detrick & Carson Investment Research: NDR Research |
As we have noted, numerous positive factors helped contribute to the strong price action that markets exhibited to finish 2023. A perceived soft landing in the economy, solid expected earnings growth in 2024 / 2025, and broad participation with various “cheap” areas of the market catching up to mega cap technology stocks are all noteworthy. But the recent plunge in interest rates is the single most important catalyst for the rally in risk assets in our view.
The steady march higher in interest rates during the fall was certainly the main culprit behind the corresponding correction in global stock markets. It is hard to believe that only two months ago most media outlets were talking endlessly about further interest rate hikes from the Federal Reserve and the havoc “6% yields” would cause for most asset classes.
While the Fed has certainly pivoted by effectively acknowledging this rate hiking cycle is complete, how intermediate- and longer-term yields will behave in 2024 remains a complex calculation. Treasury issuance is going to increase meaningfully this year to fund our exploding debts and deficits. This concern was endlessly highlighted by many analysts last October, only to seemingly vanish overnight during the last couple of months.
The Fed is forecasting three 25 basis point rate cuts in 2024 in their own Summary of Economic Projections. In contrast, the bond market has priced in 150 basis points of rate cuts for 2024. In some regards, equity markets seem even more optimistic in the sense that they too believe in the 6 rate cuts but are counting on them in unison with 10% +/- earnings growth.
The goldilocks scenario of (meaningfully) lower interest rates across the yield curve with economic growth remaining solid and inflation continuing to fall could be a high hurdle for markets to deal with during the first half of 2024. We doubt the path for intermediate interest rates is straight down from here, given how far ahead of the Fed the bond market seems to be. Risk will be repriced if interest rates reverse higher again, thus leaving a seemingly narrower path to “goldilocks” than the markets may currently be considering.
There has been no shortage of reminders to anyone who is willing to listen, that “monetary policy acts with long and variable lags.” The economy is not yet past the historical range of time horizons between initial Fed rate hikes and the beginning of a recession. Several traditional recession indicators continue to flash red, namely inverted yield curves, negative year over year growth in US Leading Economic Indicators, negative year over year growth in the money supply, contracting bank lending, and signs of the consumer becoming increasingly stretched. According to Joe Zidle, the CIO at Blackstone, the US has experienced a recession in 14 of the last 16 Fed hiking cycles with 1963 and 1994 being the two exceptions.
Bearish investors are fond of mentioning that “this time will be different” if the economy avoids a recession. But regardless of the economic outcome in 2024, we need to remember that this time is “different” on countless fronts. Five reasons why this cycle has been unique include:
Could we have already had a recession and not realized it? Although it was fractional, real GDP shrank in Q2 2022 vs. Q1 2022. In addition, several pockets of the economy have fallen into recession at various times over the last few years. China and Europe are likely in a recession currently, but this won’t last forever. BofA Global Research has a proprietary economic Regime Indicator that flipped from “Downturn” to “Recovery” in August of last year. If we had to guess, even their own economists might have been flabbergasted by the output of this model in real time.
It is undeniable that corporate earnings growth and economic growth are correlated over time. In other words, companies cannot sustainably grow earnings if the economy is not growing. Having said this, primary drivers of growth are not the same for the economy vs. corporate earnings. The predominant engine of the US economy is the consumer, while the stock market is more sensitive to goods / manufacturing.
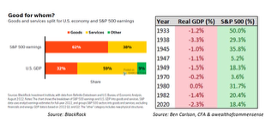
Source: BlackRock Source: Ben Carlson, CFA & awealthofcommonsense
Most of corporate America experienced an earnings recession in 2022 & 2023. S&P 500 earnings have been flat for over two years and were down on a year over year basis in Q2 & Q3 of 2023. The earnings contraction for “main street America” (i.e., small & mid cap stocks) was even more severe, but corporate earnings look to be reaccelerating across the board in the quarters ahead.
Regardless of the recession outcome, one thing for certain is that this has been the most forecasted recession in modern history. CEO’s & CFO’s did everything they reasonably could to prepare for a recession – shoring up balance sheets, resetting expenses, and restraining themselves on less certain future investments. Could a new CAPEX cycle mean the worst of the earnings recession is behind us even if economic growth grinds to a halt for a couple of quarters in 2024?
Dan Clifton of Strategas Research Partners published extensive work last year about the stealth liquidity which was deployed into the economy. This is counterintuitive on many levels given the fact that the Fed continues to shrink their balance sheet through their quantitative tightening program. Nonetheless, the Fed’s Reverse Repurchase facility coupled with the government’s spending down of the Treasury General Account supplied ample liquidity to the economy in 2023. And this does not even speak to the fact that the government ran all time high budget deficits as a percentage of GDP, outside of wartime / recession.
Dan and his team have a package of extensive charts which plot their proprietary “Strategas Net Liquidity Indicator” against the price of various assets including the S&P 500, Bitcoin, bond yields, the US dollar, etc. One doesn’t have too look very hard at the chart below to observe that liquidity was a meaningful tailwind for the S&P 500 in 2023, after having had the exact opposite effect in 2022.
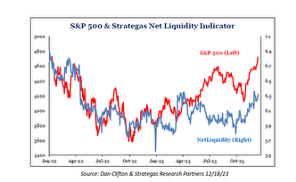
Source: Dan Clifton & Strategas Research Partners 12/18/23
The stealth liquidity injections from 2023 serve as a good reminder that policy makers have plentiful (lesser known) policy tools capable of boosting the economy over shorter time frames. In his year ahead outlook, Jason Trennert from Strategas Research Partners wrote “To the extent to which 2024 will be a year in which national elections will take place in countries that represent more than 40% of the world’s population and 80% of its stock market capitalization, we believe it is important to remember that incumbents will be even more incentivized to keep their economies out of a recession at all costs. In that regard, our forecasts for the markets must and will include very careful consideration of more than just overall liquidity in the system, but also efforts to aggressively manipulate previously arcane tools like the Treasury’s refunding schedule and its General Account, the overnight Reverse Repo market, and the Fed’s Bank Term Funding Program.“
The list of variables with the potential to influence asset prices only seems to expand as our capital markets continue to evolve in their complexity. The government’s ability and willingness to influence asset prices over shorter time horizons also continues to increase. Tom Tzitzouris from Strategas Research Partners wrote “With utilization of the TGA, we’ve entered the era of “Treasury directed QE.” It’s a threat to the Fed’s independence, the taxpayer, financial market stability, and price stability, to allow the Treasury to smooth over seasonal liquidity for political gain. Structurally, this should lead to higher inflation, higher rates, and more contested fiscal debates in the future, all of which should challenge financial market valuations.“
As we have insinuated throughout this writing, making short term equity market forecasts is an extremely difficult task. Having said this, we do want to highlight this instance when various schools of research seem to be converging on a similar conclusion (we do not believe this is a “consenses” viewpoint either). As we wrote about in bullet point #5, equity markets are short term overbought on most metrics and are likely in need of a breather before any further meaningful advance is likely to occur. At the same time, uptrends are well solidified for the time being, and numerous “buy signals” suggest higher than average probabilities for positive returns this calendar year.
Tom Lee is usually one of the biggest “bulls” on Wall Street, and he has one of the highest S&P 500 price targets among strategists for this year, as is often the case. However, he believes that most of this year’s gains will be back-end loaded as markets will need to spend some time chopping around near the previous all times highs while investors wait for more clarity from the Fed regarding the timing of rate cuts this year.
Michael Hartnett from BofA Global Research has generally had a more cautious tone on risk assets for most of the last couple of years. But he also believes that a broad based rally in risk assets could occur during the back half of 2024. The difference is that Hartnett believes we will have a legitimate growth scare (if not a recession) first, therefore meaning this eventual rally would generally occur from lower price levels. In his 2024 The Year Ahead report Hartnett wrote: “3Cs = 3Ps = 3Bs: we don’t think Wall Street bear ends until Credit, Crude & Consumer threaten hard landing / credit events, triggering bearish Positioning, recessionary Profits & Policy panic, which in turn triggers ’24 bull markets in Bonds, Bullion & Breadth.“
Stephen Suttmeier, who heads the technical strategy team at BofA Research, is yet another strategist who generally supports this viewpoint. In his first research note of 2024 he wrote “Given the big bases across many US equity indices and plenty of confirmation from other key indicators in late 2023, we believe that a tactical hangover in early 2024 should precede a solid 2024.” In a separate research piece, Suttmeier also noted that a failed Santa Claus rally and a negative first five trading days of the year are meaningful indicators which suggest a weaker year ahead, especially during the first half. One of his charts cited that, when the first five days of January are positive, the average S&P 500 return for the year is 11.22% with 75% of years being positive. The average February – December return (after a positive first five trading days) is 8.72% with 78.13% positive returns for the period. This is in stark contrast to when the first five trading days of January are negative, as they were in 2024. When this occurs, only 50% of years are positive with an average return of 1.11%. For the February – December period, 56.25% of periods are positive with an average return of 2.09%. This data encompasses all calendar years from 1928 – 2023 (source: Stephen Suttmeier: BofA Global Research: Santa Delivers a Lump of Coal 1/4/24).
Finally, seasonality in presidential election years also corroborates the thesis of a relatively more difficult first half of the year followed by stock market gains in the back half of the year.
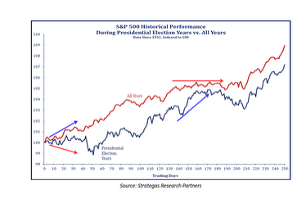
Source: Strategas Research Partners
In conclusion, we enter 2024 with extreme humility as we find ourselves having more questions than answers for what may lie ahead in the year to come. Recession or soft landing? How much of the upside economic growth surprise in 2023 was due to fiscal stimulus? Will Geopolitical events disrupt markets in 2024? What impact will center city office commercial real estate have on the economy / banking system? Can the Fed really cut rates six times if economic growth remains solid? Will we experience a second wave of inflation as financial conditions have eased? Will QT eventually have a negative effect on asset prices since QE was so generous to asset prices? Did the Q4 2023 rally pull forward much of 2024’s stock market gains similar to 2017 / 2018? Or was October 2023 the beginning of a new multiyear bull market (even though stocks bottomed in October 2022)? Can a new bull market begin with historically high valuations (for the S&P 500) and low unemployment? Has the new “fair value” multiple for the S&P 500 permanently rerated higher (18x – 19x instead of 15x – 16x NTM EPS) given the fact that many technology stocks seem to warrant above average market multiples? Will market performance mean revert across asset classes or is this like the late 1990’s when tech stocks led year in and year out? How much of the $6T in money market funds will find its way into risk assets? How will AI affect our lives in the years to come?!
All of these questions fascinate us, even if some of them make us worry a bit. At the same time, we find ourselves optimistic about the prospects for well diversified portfolios over intermediate to long term time horizons, which is a distinct improvement from the end of 2021 when nearly everything was expensive and bond yields were near 0%. As humans we are wired to think about what could go “wrong” much more than what could go “right.” The realistic probability of a fourth industrial revolution / technology led productivity boom only seems to be gaining traction by the day.
2024 will undoubtedly present investors with plenty of surprises. We continue to believe that our portfolios are well positioned to withstand the inevitable bumps along the way while also capturing the positive outcomes which will reward investors in the years ahead.
It is our honor and privilege to work with you and your families. We look forward to seeing you in person in 2024.
Sincerely,
Brian Gift, CFA
Chief Investment Officer
MBL Advisors
Bob Farrell is a legendary Merrill Lynch strategist who published his timeless list of 10 investing rules several decades ago, a version of which can be found here: https://www.investopedia.com/articles/fundamental-analysis/09/market-investor-axioms.asp.
We have written about Bob Farrell’s rules on multiple occasions in the past. Nonetheless, the simple brilliance of these rules always amazes us each time we observe them.
This content was prepared by MBL Advisors and reflects the current opinion of the firm, which may change without further notice. This report is for informational purposes only and is not intended to replace the advice of a qualified professional. Nothing contained herein should be considered as investment advice or a recommendation or solicitation for the purchase or sale of any security or other investment. Opinions contained herein should not be interpreted as a forecast of future events or a guarantee of future results. Different types of investments involve varying degrees of risk, and there can be no assurance that any specific investment will either be suitable or profitable for a client’s portfolio. Economic factors, market conditions, and investment strategies will affect the performance of any portfolio and there are no assurances that it will match or outperform any particular benchmark. Commentary regarding the returns for investment indices and categories do not reflect the performance of MBL Advisors or its clients. Historical performance results for investment indices and/or categories generally do not reflect the deduction of transaction and/or custodial charges or the deduction of an investment-management fee, the incurrence of which would have the effect of decreasing historical performance results. Investors cannot invest directly in an index.
The indices referenced herein have been selected because they are well known, easily recognized by investors, and reflect those indices that the firm believes, in part based on industry practice, provide a suitable benchmark against which to evaluate the investment or broader market described herein. Although certain information has been obtained from sources believed to be reliable, we do not guarantee its accuracy, completeness, or fairness. We have relied upon and assumed without independent verification, the accuracy and completeness of all information available from public sources.
This material is provided for informational purposes only. It is not an offer or solicitation to buy or sell any securities. Past performance does not guarantee future results, which may vary. The value of investments and the income derived from investments will fluctuate and can go down as well as up. A loss of principal may occur.
MBL Advisors Inc. is independently owned and operated. Investment Advisory Services are offered through MBL Wealth, LLC, a Registered Investment Advisor. Securities are offered through M Holdings Securities, Inc., a registered broker/dealer, member FINRA/SIPC.
File # 5079645
Consistently, we think about the idea that “markets often do what causes the most amount of pain for the most amount of people”, at least over shorter time frames. The first half of 2023 has been another sterling example of this notion, as many investors remain as underweight equities as at any point since 2009, according to the June Bank of America Global Fund Manager Survey. A consensus rationale for investors in 2023 has been “why” would they own risk assets into the teeth of a “surefire” recession if short term treasuries are paying them 5%. Light investor positioning, elevated cash levels, and extremely bearish sentiment unleashed a “pain trade” to the upside for US equity markets during the first half of 2023, contrary to most of the Wall Street year ahead forecasts which believed investors would be faced with a “difficult” start to the year. Thus, we can add 1H23 to the list of countless examples of why investors are best served by sticking to their process and staying invested with a long-term mindset.
Investors can always construct compelling bullish and bearish narratives to support their thesis as to why equity markets may head higher / lower over the months to come. This dynamic is especially pertinent right now as various signals are becoming increasingly conflicting. On one hand, the weight of the economic data remains weak, and US Large Cap equities could be fully valued, even for the scenario where the economy avoids a recession. Conversely, investor positioning remains offsides (although it is less so) with FOMO beginning to set in, as technicals gradually improve for global equity markets, including some “buy signals” which favor bullish outcomes when looking out over the next 6 – 12 months.
With this in mind, we have outlined a few bearish viewpoints along with bullish counterpoints to these generally well-known bearish narratives.
Many economists continue to believe that a recession is around the corner for the US economy. A plethora of indicators with near flawless track records are signaling that a recession will begin sometime in the next few months. Inverted yield curves are one of the more highly predictive economic indicators, and both the 10-year vs 2-year treasury yield curve as well as the 10-year vs 3-month treasury yield curve are as negatively inverted as we have seen in 40 years. In addition, since at least 1960, every time the year-over-year change in US Economic Leading Indicators (LEI’s) reached -5, the US economy went into a recession (source: MBL Advisors & FactSet). The current year over year change in LEI’s is -8 (source: MBL Advisors & FactSet).
A tight labor market has kept the consumer afloat thus far, but initial jobless claims have risen steadily since bottoming in October 2022. The 6-month moving average of initial jobless claims is about to cross the 24-month moving average to the upside, another indicator with an incredibly strong track record of predicting recessions which will signal imminently. These cracks in the labor market are appearing just as student loan payments are going to resume (avg. payment is $383 per month according to Strategas Research Partners), and this is alongside other fixed living expenses which have skyrocketed over the last few years (rents, car payments, credit card payments (with higher balances & higher rates, etc.).
The US is a consumer-driven economy, and the average consumer could be faced with a more fragile personal financial situation than they have become accustomed to over the last couple of years. The Fed’s own yield curve-based model places a 70% probability of the US economy entering recession at some point within the next 12 months.
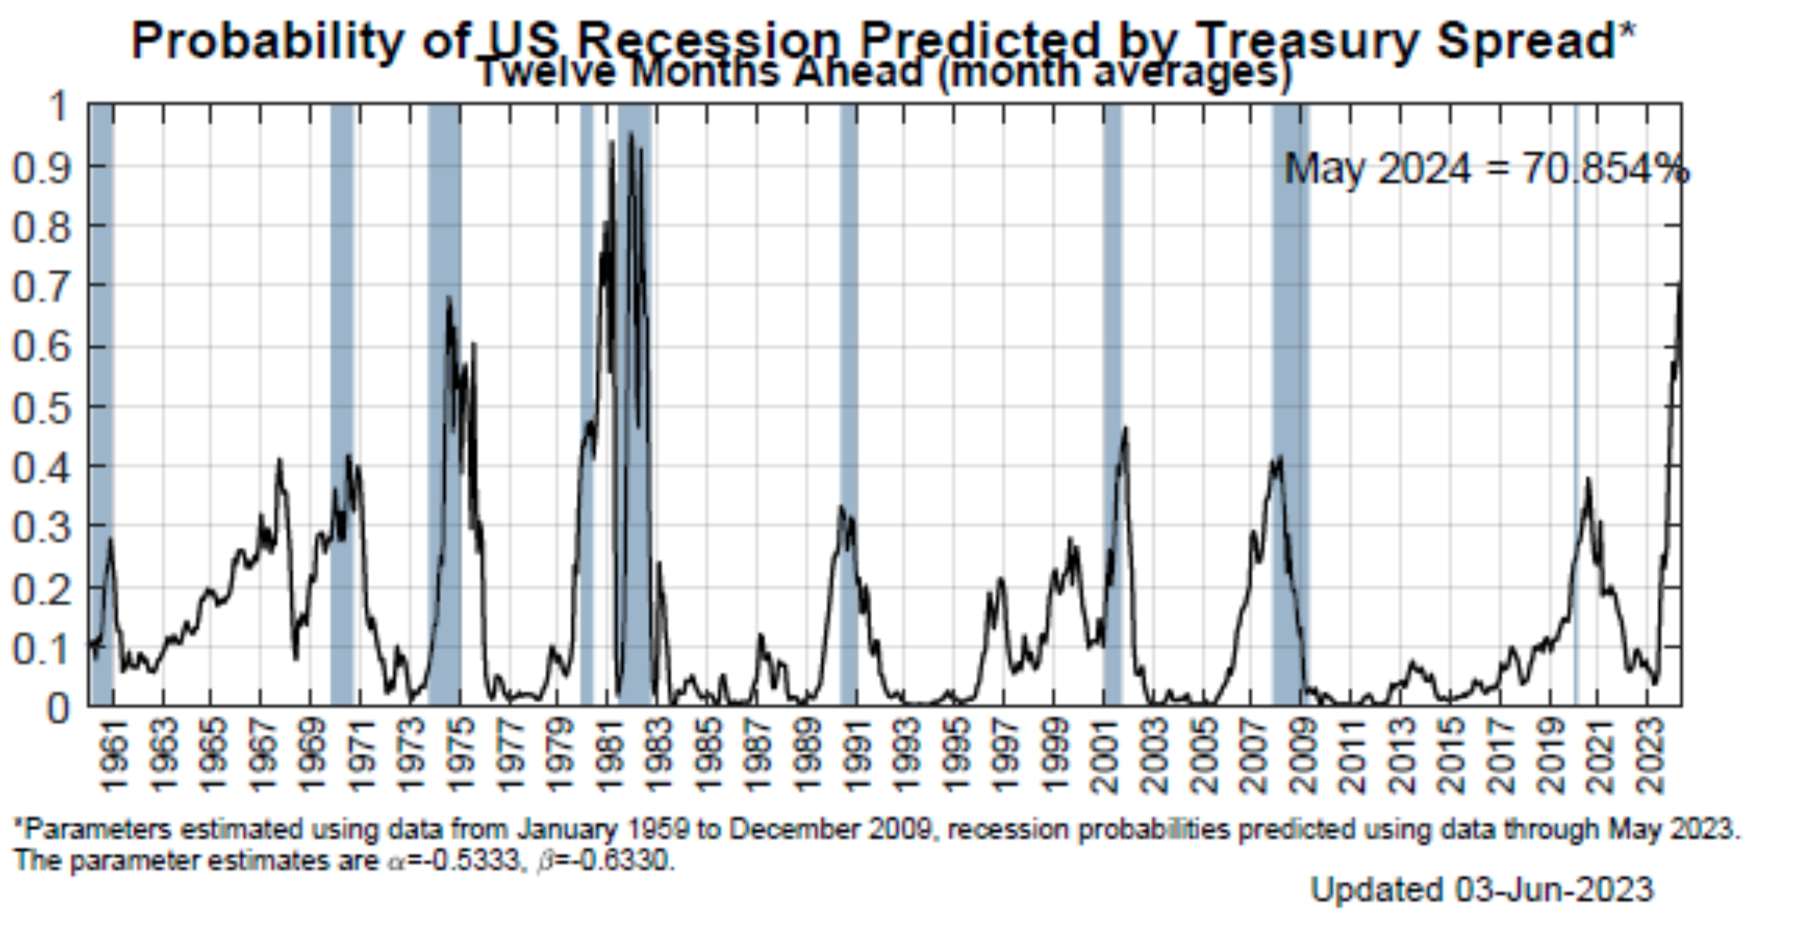
We discussed the rolling recession scenario in our ISO from December 2022, which is exactly what has played out to this point. Economists have been talking about an “imminent” recession for the last year and a half, yet the economy has failed to “break” in any significant fashion. In aggregate, US economic data has actually been surprising to the upside according to the Citi Economic Surprise Index, and this can also be seen in a variety of individual data points such as PMI’s stabilizing, strong housing data, better than expected Durable Goods and 17-month highs in Consumer Confidence.
Not coincidentally, the “soft landing” camp has grown as equity markets have marched steadily higher since the epicenter of the regional banking crisis. Morgan Stanley’s CEO James Gorman noted that he believes capital markets activity has troughed, recently stating “I feel like we’ve bottomed on this. I just feel the tone is a little better. We’re clearly seeing more green shoots. I’m having more discussions with CEO’s.” (Source: https://www.ft.com/content/4256b07b-789f-4f87-a10e-db9db951c3c4)
On top of this, economists from Goldman Sachs and Credit Suisse echo a more optimistic economic outlook as well. Within the last month, Goldmans Sachs reduced their odds of a recession within the next 12 months from 35% down to 25%. (Source: Goldman Sachs; Why a US Recession has become less likely; https://www.goldmansachs.com/intelligence/pages/why-a-us-recession-has-become-less-likely.html.)
Just this week, Credit Suisse noted that “U.S. Recession might not hit until 2026.” They are basing this on the observation that recessions usually don’t begin until the yield curve flattens out after the inversions occur, and Treasury futures markets are not pricing this in until June 2026 (Source: https://ph.investing.com/news/stock-market-news/us-recession-might-not-hit-until-2026–credit-suisse-432SI-915754).
Clearly stock market bulls are strongly rooting for this to be one of the rare instances where the Fed can “thread the needle” and avoid a recession as they did with their 1994 / 1995 tightening cycle.
A final bullish interpretation of the current economic environment could be that this entire inflation and interest rate cycle has been part of a great “normalization” process for the economy / monetary policy, following the tremendously unnatural circumstances which policy makers unleashed in 2020 and 2021. The Atlanta Fed’s GDPNow indicator currently supplements this viewpoint as it expects Q2 Real GDP to be 1.9%.
The S&P 500 is back to trading at 19x forward earnings, which is the highest level ever for the S&P 500 outside of the tech bubble or the COVID bubble (Source: MBL Advisors & FactSet). This is also the exact multiple of forward earnings the S&P 500 peaked at in January 2020 just prior to COVID. 2022 made significant progress in correcting excess valuations throughout all types of asset prices (except housing in some parts of the country). At the October 2022 lows, the S&P 500 traded around 15x forward earnings estimates (down from the COVID peak of 24x forward EPS). Although far from perfect, starting valuations are very good at helping to predict longer-term forward returns. Even if corporate earnings continue to stabilize and the economy avoids a recession, investors are left questioning how much “good news” is already priced into risk assets, especially if corporate earnings don’t reaccelerate to the upside. At 19x earnings, the thesis for incrementally owning the risk-free asset, yielding over 5%, only increases in validity.
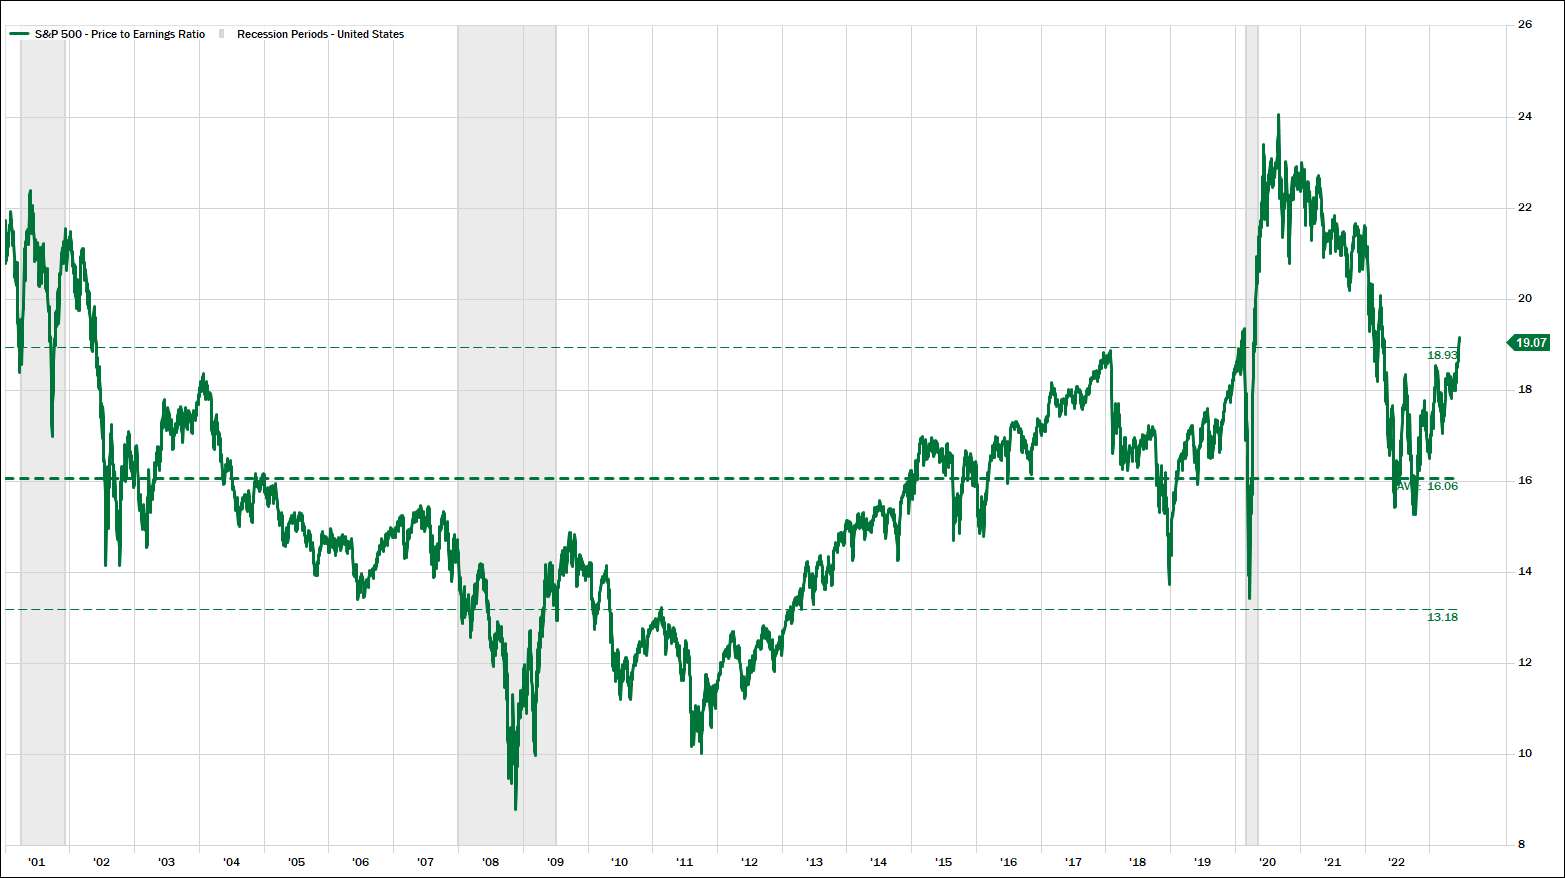
Whether we reorganize the S&P 500 to the equal weighted S&P 500, or the S&P 500 ex Tech or even the S&P 490 (excluding the ten largest stocks), we would reach the same conclusion that valuations excluding mega cap tech are roughly in line with longer term historical averages at around 15.5x – 17x forward earnings. This dynamic is even more pronounced if we shift our focus to US Mid Cap, US Small Cap, or Intentional Developed equity markets, which are all trading cheap to their own long term historical averages. Regardless of the next 10% + move in equity markets, historically investors have been rewarded with 5 – 10 year forward returns when putting capital to work around these valuations in US Mid Cap, US Small Cap, and International Developed equities.
In addition, there is plenty of legitimacy to the viewpoint that the best secular growth business in the history of corporate America deserves a premium valuation (maybe the “Magnificent 7” aren’t overpriced given their monopolistic characteristics?). And this is only accentuated by the fact that their balance sheets are nearly bulletproof, and these same businesses could be the best positioned to capitalize on the potentially massive AI theme (what does AI do to their future earnings power?).
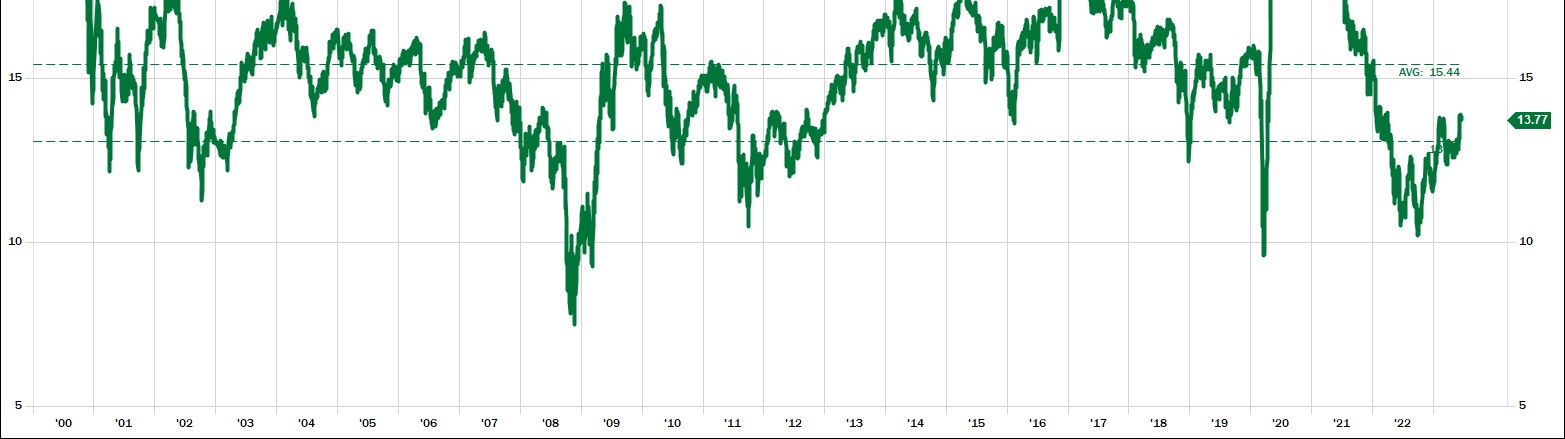
At the end of May, the S&P 500 was up 9.5% year to date. According to Chris Verrone and Strategas Research Partners, the top 10 market cap weighted names had accounted for 104.1% of the total S&P 500 gains, which was the highest contribution by the top ten names ever, on a calendar year basis going back to 1990. Said another way, ten stocks carried the market 10% higher all by themselves, in the two-and-a-half-month period following the SVB failure. On top of this, outside of the blowout earnings guidance from Nvidia, nearly all of this rally was attributable to multiple expansion, which of course isn’t sustainable over longer time frames.
Bob Farrell, the famed Merrill Lynch strategist, taught us that markets are strongest when they are broad and weakest when they narrow to a handful of blue-chip names (i.e. 2007, 2021, etc.). Currently, we are back to a spot where the Technology and Consumer Discretionary sectors have outsized weightings in the S&P 500 Index relative to their earnings contribution (the market is betting they will “grow” into this). We witnessed a similar dynamic with technology stocks in 2000 and to a lesser degree financials in 2008.
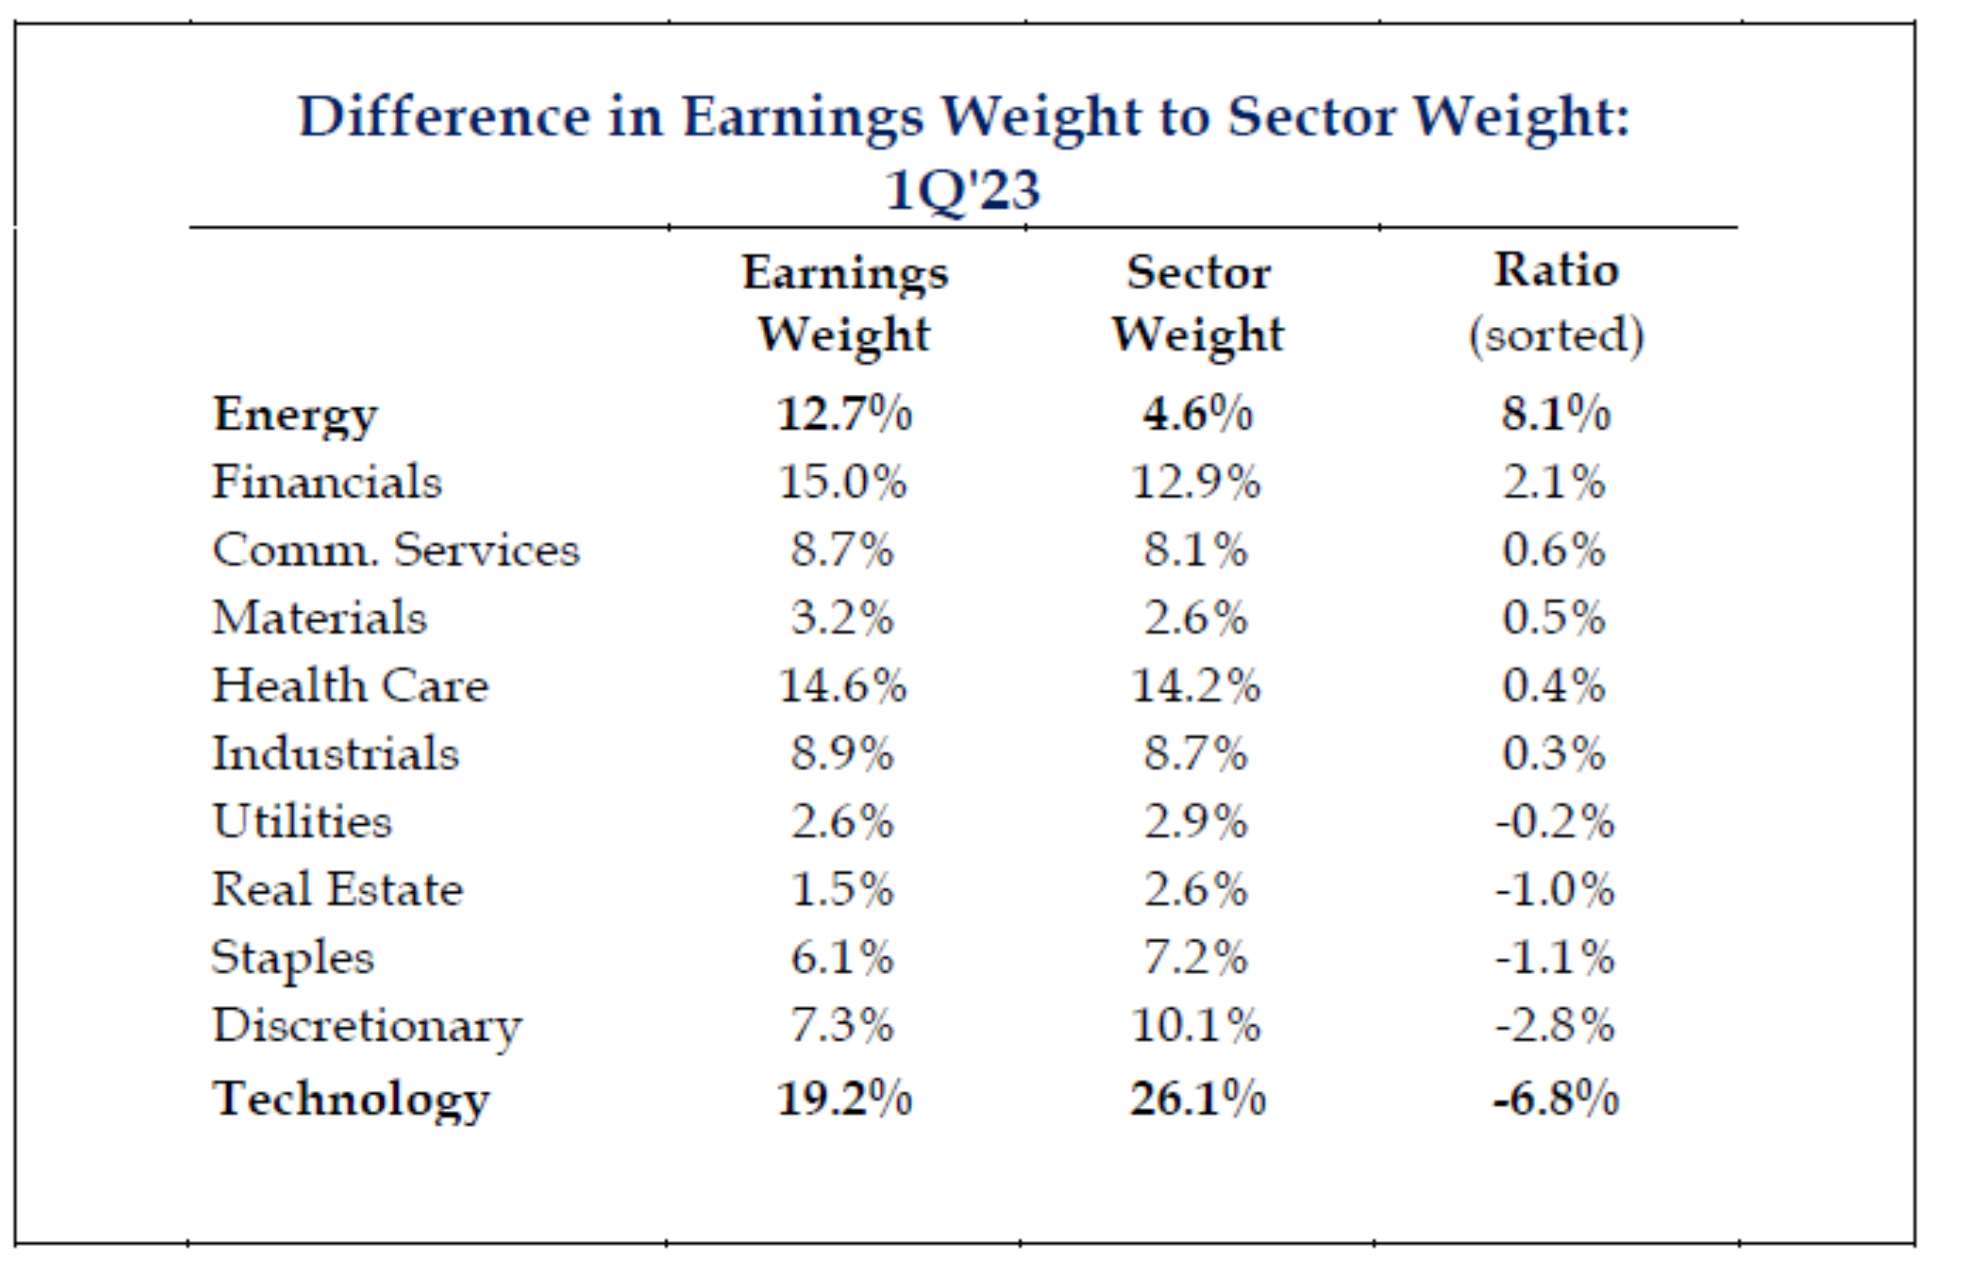
The S&P 500 held its 200 week (almost 4 year) moving average during the 2022 bear market and is now trading well above its upward sloping 200 week moving average. Trading above an upward sloping 200 week moving average coupled with defending this moving average during a meaningful test of it (twice in 2022) is evidence that US equity markets remain in a secular bull market (which began in either 2009 or 2013 depending on who you ask) according to many market technicians.
In addition, the S&P 500 experienced a Golden Cross (where the 50-day moving average crossed above the 200 day moving average) at the end of January 2023. The S&P 500 is currently trading above its upward sloping 200 day moving average, which can be viewed as a signal that we are in a cyclical bull market as well. Furthermore, global equity markets have been anything but narrow for the past month, as a wide variety of stocks / sectors / styles, etc. (cyclicals, small caps, etc.) have posted respectable gains in June. Breadth tends to lead prices, and we could be getting closer to having confirmation that this rally is broadening out.
Ryan Detrick of the Carson Group pointed out numerous constructive indicators recently which give further support to the bullish narrative.
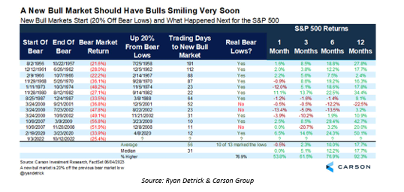
Although a 20% gain over 8 months is a weak rally compared to other historical advances marking the beginning of a new bull market, the combination of a 20% gain and a relatively long-time frame (8 months) favors the bulls even more as most other bear market rallies in excess of 20% happened over the course of a couple of months and resumed lower again in a relatively quick manner.
Post 2008, the correlation between the S&P 500 and the Federal Reserve balance sheet is nothing short of amazing and / or shocking. They have basically moved in lock step with one another for most of the last 15 years.
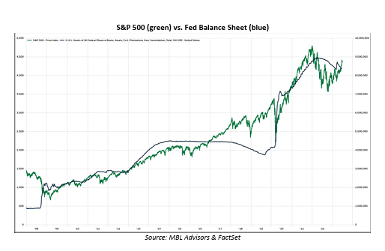
The Fed has been conducting quantitative tightening (QT) (shrinking their balance sheet) as a part of their more restrictive monetary policy stance for the last year. This comes after the Fed made a habit of expanding their balance sheet (QE) when they wanted to further ease financial conditions at various times over the last 15 years but were restricted by more traditional methods since short term interest rates were already at 0%. Despite the Feds ongoing QT program, the Fed’s policy response to the regional banking crisis in March caused the Fed’s balance sheet to expand once again and unwound several months of QT in a couple of weeks.
Congruent with the Fed’s emergency lending program to help give some relief to bank balance sheets, the U.S. government was spending down the Treasury General Account (TGA) (essentially the government’s operating account) as debt ceiling limitations prevented them from borrowing (issuing more debt) additional funds. This served as an even larger injection of liquidity into the financial system than the Fed’s emergency lending facility, and the combination of these two programs helped to massively ease financial conditions during the first half of 2023 (unexpected tailwind for stocks).
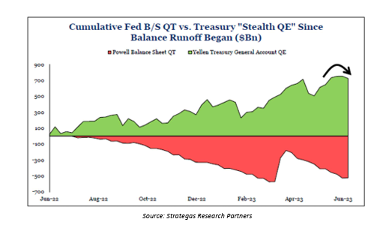
Now that the debt ceiling has been raised, the government will go back to borrowing money (instead of spending “savings”) in order to facilitate their deficits, which will drain liquidity from the economy as the Fed is no longer funding the government’s deficits through their QE programs. Further, the TGA will need to be restocked, and all of this will occur as QT continues on its planned path. Thus, “net liquidity” to the financial system is going to shift from a tail wind in Q2 to a head wind in Q3 and beyond. We will see how equity markets handle this dynamic, but investors don’t have to extrapolate too far to believe that markets may struggle, given how positively risk assets have reacted to liquidity injections (100% of the time) over the past 15 years.
We want to emphasize the fact that the full “bite” from tighter monetary policy probably has not been felt yet. Central bankers constantly remind us that monetary policy “acts with long and variable lags.” The vast majority of rate hikes are less than one year old, and the Fed seems to be increasingly tied to their “higher for longer” policy stance. This would hold the Federal Funds Rate at a level which is substantially higher than trend growth rates for the US economy, which doesn’t seem sustainable to us. “Higher for longer” interest rates coupled with QT and TGA restocking seems like an underappreciated risk to us.
First and foremost, headline inflation has declined for 11 months in a row. Even though the precise bottom for most equity indices occurred in October of last year, the October lows barley undercut the June 2022 lows and many individual stocks actually bottomed in June of last year. Coincidentally or not, June of last year was also when inflation (CPI) peaked at 9.1%. Year-over-year inflation could be below 3% when we receive the June 2023 inflation data in mid-July (although this will very likely be the low CPI print for the remainder of 2023).
Next, earnings have been much “better than feared” so far this year, and 2023 & 2024 earnings estimates have stabilized and begun to tick higher over the past couple of months. This is even more pronounced when looking at S&P 500 earnings ex-Energy – helping to isolate the fact that oil has been down big over the last year. Savita Subramanian and BofA Global Research recently upgraded their 2023 S&P 500 earnings forecast to $215, from their previous estimate of $200 per share. Savita and her team also see additional earnings growth in 2024, estimating S&P 500 earnings per share to come in around $235. If the trough in corporate earnings for this cycle comes to fruition in Q2 / Q3 2023, then equity markets bottoming out in October 2022 will line up perfectly with history, as the S&P 500 usually puts its lows in place roughly a year ahead of earnings on average.
Third, the Mediterranean restaurant CAVA had its IPO on June 15, 2023. CAVA’s stock (which has nothing to do with AI!) went up over 100% that day and has held onto its gains since then. This comes after the IPO market spent the better part of the last two years in a draught. Although this is a relatively small anecdote, IPO’s usually don’t even come to market during bear markets (2022) let alone go up 100% on their first day of trading.
There are plenty of other signs of “bull market” price action as well. Defensive sectors are the worst performing sectors year to date (after posting some of the best relative performance last year). A more granular way to observe cyclical vs. defensive leadership is to view consumer discretionary stocks vs. consumer staples stocks (which gave a great warning signal in late 2021 / 2022). Currently, consumer discretionary stocks are exhibiting strong relative strength vs. consumer staples, confirming the ascent in global equity markets year to date. The same thing is happening with Industrials (very cyclical) vs. the equally weighted S&P 500. At some point, investors need to respect the collective wisdom of the market, regardless of the “macro” narrative.
In addition, we mentioned in our December 2022 ISO that stocks would likely move higher if the VIX traded lower than its average in 2022. So far, this has played out to an even larger degree than even the most bullish investors could have expected with the VIX trading as low as 12 recently (it never got this low in 2020 / 2021) versus an average reading of 25 in 2022.
When the “crosswinds” are this strong it becomes more difficult for investors to formulate high conviction conclusions while also maintaining their humility and discipline within their investment process. The economic and earnings data clearly leaves a lot to be desired. At the same time, the “bear thesis” is relatively stale, as the much-feared economic recession and ensuing earnings decline has yet to take place while the Fed and inflation have become relatively “known” factors, at least on the surface (we seem to be past large surprises around inflation and the Fed should be very close to finished with their interest rate hikes).
We firmly believe that the collective knowledge of the markets is usually more astute than any individual investor, but the exception to this rule is around big turning points in markets. The bulls couldn’t ask for too much more from the internal signals that US equity markets are currently generating. At the same time, the current rally will either mark the weakest start ever to the beginning of a new bull market or one of the longest and strongest bear market rallies of all time.
Increasing risk at 19x forward earnings on the S&P 500 has not been overly rewarding to investors traditionally. Nonetheless, markets always look more expensive than they actually are just before earnings reaccelerate, and this dynamic will only be accentuated if (and this is a BIG “if) we are on the verge of a new CAPEX cycle driven by AI on reshoring of manufacturing.
When we reflect upon our December 2022 ISO, we are surprised by how many of the ideas we outlined have been at least directionally correct. Having said this, there has been one investment theme which has trumped all others so far in 2023, and that has been the massive outperformance of mega cap technology related stocks vs. everything else. This has surprised us to some degree as we continue to see the case for a shift to secular leadership from “inflation assets” rather than the “deflation assets” which dominated the 2010’s during the QE era. At the same time, we also believe that the end of the QE era will place an increased importance on emphasizing fundamentals, as the cost of capital has normalized, and in this regard, investors might continue to be rewarded by sticking with mega cap technology stocks (valuations aside).
Markets never presented investors with the “fat pitch” that everyone seemed to be waiting for, and this has left many allocators of capital “frustrated” with the current market dynamics. Observing global equity markets this year has left us wondering if markets have become increasingly efficient at discounting the future state of the corporate landscape, including investors being willing to look out further into the future than they traditionally were willing to in the past.
In light of all of this, we continue to feel good about our portfolio construction, which is positioned to (i) meaningfully participating during broad based equity bull markets, while minimizing single stock risks; (ii) have roughly ¾ of our equity exposure directly hedged against downside risks in equity markets; (iii) emphasize yield from high quality securities in both equities and fixed income which will allow portfolios to continue to slowly compound gains over time, including in broad range bound markets which we have experienced on numerous occasions throughout history; and(iv) continuing to modestly extend duration within fixed income portfolios as interest rates move higher as we continue to believe that high quality bonds will act as a good stabilizer to portfolios if equity markets experience any significant downside movement.
In summary, we continue to believe our portfolios are constructed to emphasize our discipline of “taking what the market gives us” within the construct of our long-term investment plan. We are extremely grateful for the trust that you place in our team at MBL Advisors, and we look forward to discussing these topics with you in more detail sometime this summer.
Sincerely,
Brian Gift, CFA
Chief Investment Officer
MBL Advisors
Bob Farrell is a legendary Merrill Lynch strategist who published his timeless list of 10 investing rules several decades ago, a version of which can be found here https://www.investopedia.com/articles/fundamental-analysis/09/market-investor-axioms.asp.
It seemed some investors believed these rules were no longer as relevant as they once were when they didn’t hold true to form during the extremely abnormal bear market and subsequent recovery in 2020 and 2021. However, all of these rules seem especially pertinent today as we proceed thorough a more traditional market environment where the 800 pound gorilla (the Fed) is no longer the overriding factor. We have written about Bob Farrell’s rules on multiple occasions in the past. But their timelessness and truth always amaze us each time we observe them.
Disclosures:
This report was prepared by MBL Wealth, LLC, and reflects the current opinion of the firm, which may change without further notice. This report is for informational purposes only and is not intended to replace the advice of a qualified professional. Nothing contained herein should be considered as investment advice or a recommendation or solicitation for the purchase or sale of any security or other investment. Opinions contained herein should not be interpreted as a forecast of future events or a guarantee of future results. Different types of investments involve varying degrees of risk, and there can be no assurance that any specific investment will either be suitable or profitable for a client’s portfolio. Economic factors, market conditions, and investment strategies will affect the performance of any portfolio and there are no assurances that it will match or outperform any particular benchmark. Commentary regarding the returns for investment indices and categories do not reflect the performance of MBL Wealth, LLC, or its clients. Historical performance results for investment indices and/or categories generally do not reflect the deduction of transaction and/or custodial charges or the deduction of an investment-management fee, the incurrence of which would have the effect of decreasing historical performance results. Investors cannot invest directly in an index. The indices referenced herein have been selected because they are well known, easily recognized by investors, and reflect those indices that the Investment Manager believes, in part based on industry practice, provide a suitable benchmark against which to evaluate the investment or broader market described herein. Although certain information has been obtained from sources believed to be reliable, we do not guarantee its accuracy, completeness or fairness. We have relied upon and assumed without independent verification, the accuracy and completeness of all information available from public sources. This material is provided for informational purposes only. It is not an offer or solicitation to buy or sell any securities. Past performance does not guarantee future results, which may vary. The value of investments and the income derived from investments will fluctuate and can go down as well as up. A loss of principal may occur.
Investment Advisory Services are offered through MBL Wealth, LLC, a Registered Investment Advisor. Securities are offered through M Holdings Securities, Inc., a registered broker/dealer, member FINRA/SIPC. MBL Advisors Inc. is independently owned and operated. #4550659
Since the last time we formally wrote in mid-December, there have been some significant changes to the investment landscape. Most notably of course is that we recently experienced the largest bank failures since the Great Financial Crisis. Many investors are using this as evidence that we are at the stage of the interest rate hiking cycle where “things are beginning to break.” In turn, it is now largely consensus to believe that the Fed has achieved a restrictive monetary policy stance.
Unfortunately for the Fed, the bond market does not believe interest rates will be able to stay here for long and is now pricing in several Fed rate cuts before the end of this year, which is a drastic change even from a month ago. The entire yield curve is trading at levels below the Federal Funds Rate, and 2 Year Treasury yields might be sending the clearest message of all trading roughly 1% below the Federal Funds Rate. Historically, a significant inversion of 2-year yields vs. the Fed Funds Rate has not been a friendly economic signal, and there is no shortage of additional economic data giving investors similar negative indications.
The chart below helps depict the long history of 2 Year Treasury Yields leading the Fed Funds Rate. 2 Year Treasury Yields have been a far more reliable indicator of the future path of the Fed Funds Rate than forecasts from the Federal Reserve itself. The 2 Year Treasury yield is screaming that the Fed is going to have to reverse course sometime soon, and historically, the beginning of Fed rate cuts is often problematic for risk assets, serving as a “be careful what you wish for” dynamic.
Even though recession probabilities seem to be rising by the day, global equity markets remain relatively firm as the S&P 500 continues to “hug” the 4000 level. For perspective, the S&P 500 reached 4000 for the first time ever in April 2021, when 2-year treasury yields were 0.1%. After running up to 4800, the S&P 500 then proceeded to break 4000 to the downside in May 2022 with 2-year treasury yields around 2.6%. Since then, the 4000 level has continued to be a magnet for the S&P 500, regardless of 2-year treasury yields briefly trading above 5%, just prior to the banking issues of the last month.
The bullish case for stocks is never as “obvious” as the bearish case, and we can’t think of many instances in the last 15 years when this was more accurate than it is right now. Having said this, the few remaining bulls have noted that some of the prior bearish catalysts seem to be fading. Last December we wrote that we didn’t believe upside surprises to inflation / interest rates would drive equity markets to new lows, and this seems to have been solidified in the wake of the recent banking turmoil. In addition, a couple of notable bank failures were not enough to even take the S&P 500 back to its December 2022 lows (which was above THE lows). In other words, markets will likely need a new negative catalyst(s) to emerge (there are no shortage of candidates) to break the S&P 500 through the lower end of its fairly pronounced 3800 – 4200 trading range.
As we begin the second quarter of 2023, we are surprised to note that the VIX is trading below 20, which is signaling that equity markets are pricing in a fairly “normal” volatility environment. Most investors probably feel as though current market conditions are anything but “normal” and even potentially combustible. But regardless of our opinions, the volatility gauge for equity markets is saying something different, at least for the time being.
Tom Lee has written extensively this year about how the Year-over-Year change in the VIX has a higher statistical significance in explaining S&P 500 returns than several other variables (including S&P 500 earnings or 10-year bond yields). Said another way, for the year after (2023) a negative return year (2022) in the S&P 500, if the average VIX reading (in 2023) is below the average VIX reading in the prior year (2022), then there is an 83% chance the S&P 500 should have positive returns this year. Conversely, if the VIX has a higher average this year relative to last year, there is only a 14% chance that the S&P 500 will have positive returns in 2023.
For additional perspective of just how statistically significant this is, there is a 78% chance that the S&P 500 will have positive returns this year if earnings growth is positive on a Year-over-Year basis (after a negative return year). While there is still a 70% chance that the S&P 500 has a positive return year in 2023 if earnings growth is negative on a Year-over-Year basis (not a major difference) (source: FSInsight & Tom Lee). Thus, equity market volatility (VIX) could be the most influential variable on equity market returns in 2023.
A more predictable and significantly less harsh Federal Reserve is one of the key factors that the bulls are relying on to help keep volatility suppressed. In other words, does a Fed that is out of the way due to sufficiently restrictive financial conditions allow for bearish sentiment along with less than optimistic investor positioning to push equity markets higher in the months to come?
Michael Hartnett from Bank of America Global Research recently noted:
History of Bears: ain’t nothing more dangerous than a bear at the end of a bear market and… inflation set to fall sharply, oil down, rates down, PMIs stabilizing, housing reacting to lower rates, lots of job openings still to fill… bears shouldn’t be dogmatically bearish 15 months into bear market; but still… history, positioning, policy & profits reasons we think stock market to attempt new lows next 3–6 months.
Hartnett is almost always on point with his thoughts, and we share his messaging above in all regards. We continue to believe it is difficult to become enthusiastic about equity market return prospects in the short term due to several fundamental issues that likely need more time to resolve. Namely:
(i) US large cap equities are trading around average valuations, in a most generous scenario;
(ii) Although inflation is clearly falling from high levels, it remains well above satisfactory levels. Historically, higher levels of inflation have yielded lower valuation metrics for equity markets;
(iii) There seems to be a lack of organic drivers of earnings growth, and if anything, forward earnings expectations likely remain too high for 2024 as profit margins continue to erode;
(iv) Unlike the QE era, there are good investment “alternatives” (bonds, gold, etc.) to equities, and equity risk premiums (compensation for investing in stocks over bonds) are around post-2008 lows;
(v) The money supply (M2) is contracting, which is a massively important variable for risk assets; and
(vi) Finally, the Fed was still conducting QE in March 2022. March 2022 also marked their first interest rate hike, which was a rather ceremonial 0.25%. This means we have experienced 4.5% of interest rate hikes from May 2022 to March 2023. The full effects of these interest rate hikes are nowhere near fully appreciated yet, as monetary policy acts with long and variable lags.
None of these factors necessarily mean equity markets “need” to fall apart, but it does lead us to believe that sustainable gains might be difficult to come by for now / until we have more clarity regarding several of the issues mentioned above.
More simply, we believe that the economic cycle likely needs to be “reset,” even if that means things getting “worse” before they get “better.” Until something along these lines occurs, fundamentally driven equity market gains are a less intuitive proposition as several reliable macro-economic variables are giving pronounced recession signals (some more strongly than others). These indicators include:
Despite the weakness across a plethora of economic variables, the labor market (and in turn, the consumer to a degree) remains somewhat unflappable, while corporate earnings and credit spreads have yet to meaningfully crack, as they typically do during a recession.
Thus, a big question today that did not exist a month ago is if the recent “banking crisis” will serve as a catalyst in beginning to erode the final lynchpins giving hope to the “soft landing” or even “no landing” scenarios.
In our opinion, there are some clear data points pointing to a meaningful tightening of lending standards over the past month. On 4/10/23 Lisa Abramowicz from Bloomberg stated that “there’s been the biggest decline in commercial lending in a two-week span in the data going back to the 1970’s.”
At the same time markets have been able to remain firm thanks in large part due to policy makers’ reactions to the banking turmoil. Jason Trennert and Dan Clifton of Strategas Research Partners have pointed out that their proprietary Net Liquidity Indicator increased by over $700 Billion in the first quarter due to spending from the Treasury General Account (TGA) along with reverse repo facilities.
The positive effects of liquidity injections on asset prices can be seen even more clearly through the lens of market leadership, as the biggest winners from 2020 / 2021 are once again the best performing asset classes year to date in 2023 (Mega cap tech stocks, non-profitable / “innovative” tech (ARKK), crypto currencies, long bonds, etc.).
Tighter bank regulation / lending standards leading to a meaningful slowdown of credit creation is a meaningfully higher probability event today than it was just five weeks ago. The banks that seem to be most affected by the recent issues (i.e., everyone except for the mega banks), are also the very banks who generally facilitate a disproportionate amount of lending to the small business community.
Small businesses are going to continue to find themselves in a more challenging environment relative to the last several years, and this could eventually lead them to “batten down the hatches” (i.e., cut jobs). As a reminder, small businesses employ 70% +/- of workers in the United States. Thus, in aggregate, small businesses will likely have a much larger effect on the unemployment rate than the “headline” layoffs already occurring in large corporate America.
An unemployment rate above 4% and / or a couple of meaningfully negative payroll reports are probably what is “needed” to make the Fed truly pivot and begin to cut interest rates. Although the beginning of an interest rate cutting cycle is historically not a bullish market event, it may serve as an indication that we are at the “beginning of the end” of this bear market and allow investors to begin to look through many of the present headwinds to better times ahead.
We have already seen corporate earnings contract to some degree on a Year-over-Year basis (-5% +/- expected in Q1 EPS), but this could accelerate if the labor market / consumer eventually breakdown.
In our own minds we rarely detail what shorter term events might look like, let alone doing so publicly. Only time will tell how various economic events unfold in the months ahead, but even if the scenario we outlined generally comes to fruition, we have far less conviction regarding how deep the corresponding sell off in global equity markets might be.
We feel somewhat strongly that this bear market does not seem “complete.” But whether this means we get a retest of the June / October lows or something more severe, we cannot forecast with any degree of conviction.
What we do continue to believe strongly about are the themes we outlined in our Investment Strategy Outlook last December (Investment Strategy Outlook – Dec 2022). At the top of that list continues to be the headline of that report, which was to “take what the market gives us.”
April is often a seasonally strong month for equity markets, and we will continue to take advantage of opportunities to marginally de-risk portfolios when equity markets seem to be trading towards the upper end of this trading range. On the other hand, if / when some negative events transpire, we will plan to be buyers of risk assets as we see signs of true panic / capitulation.
In the meantime, the 3800 – 4200 range on the S&P 500 continues to hold in a sturdy fashion as investors struggle between “lots of bad news already being priced in” vs. a lack of positive catalysts which justify moving equity markets meaningfully higher.
There are several historic examples of range bound markets, most notably in the late 1940’s and the 1970’s. One common theme between both of these time frames along with today, was entrenched inflation running well above acceptable levels.
For months, many people have believed that the Fed had backed themselves into a corner, and the recent banking crisis has only exacerbated this dynamic. Massive unrealized losses on high quality securities held on bank balance sheets are signaling that the Fed is clearly “too tight” for financial system stability, which we believe is their most important mandate, even if it isn’t directly one of their two stated mandates.
At the same time, it doesn’t seem like the Fed is satisfied yet (listen to Fed governors) with their fight against inflation, especially given that the headline CPI number remains above the Federal Funds Rate. The Fed has never begun to cut interest rates with this dynamic in place.
If financial system instability does not allow the Fed to fully finish their fight against inflation, the Fed may end up having to face the very thing they stated they wanted to avoid at all costs; the start / stop monetary policy of the 1970s when they had to “fight inflation” on three separate occasions.
Dan Clifton and Strategas Research Partners recently published a chart showing that current inflation trends are identically tracking the 1970’s. The headaches of “sticky inflation” would only be worsened by exploding interest expenses on the $31T of national debt – half of which is set to mature in the next three years.
Investors should not underestimate how impactful levels of inflation and interest rates are to investment environments. As we wrote about last December, a higher inflation, higher interest rate, lower real growth backdrop will warrant a different investment playbook relative to the QE era.
We believe that placing an emphasis on a higher degree of portfolio diversification, income becoming a more important factor in equity investing, and more frequent portfolio rebalancing will serve as critical elements to the portfolio management process in the years to come.
While we spent much of this writing detailing no shortage of concerns for investors over the next several months, we regularly remind ourselves that “markets often do what causes the most amount of pain for the most amount of people.” Stock market “bulls” are currently an endangered species, while most people believe the bearish thesis is somewhat “obvious.”
Regardless of the next 15% move in equity markets, we continue to maintain our conviction that global equity markets will be higher in five years than they are today (and meaningfully higher over longer time frames). Thus, we must continue to balance our long term, disciplined mindset with the very real “worries” that exist for investors today.
We hope to catch up with you in more detail sometime this spring.
Sincerely,
Brian Gift, CFA
This report was prepared by MBL Wealth, LLC, and reflects the current opinion of the firm, which may change without further notice. This report is for informational purposes only and is not intended to replace the advice of a qualified professional. Nothing contained herein should be considered as investment advice or a recommendation or solicitation for the purchase or sale of any security or other investment. Opinions contained herein should not be interpreted as a forecast of future events or a guarantee of future results.
Different types of investments involve varying degrees of risk, and there can be no assurance that any specific investment will either be suitable or profitable for a client’s portfolio. Economic factors, market conditions, and investment strategies will affect the performance of any portfolio and there are no assurances that it will match or outperform any particular benchmark.
Commentary regarding the returns for investment indices and categories do not reflect the performance of MBL Wealth, LLC, or its clients. Historical performance results for investment indices and/or categories generally do not reflect the deduction of transaction and/or custodial charges or the deduction of an investment-management fee, the incurrence of which would have the effect of decreasing historical performance results.
Investors cannot invest directly in an index.
The indices referenced herein have been selected because they are well known, easily recognized by investors, and reflect those indices that the Investment Manager believes, in part based on industry practice, provide a suitable benchmark against which to evaluate the investment or broader market described herein.
Although certain information has been obtained from sources believed to be reliable, we do not guarantee its accuracy, completeness or fairness. We have relied upon and assumed without independent verification, the accuracy and completeness of all information available from public sources.
This material is provided for informational purposes only. It is not an offer or solicitation to buy or sell any securities.
Past performance does not guarantee future results, which may vary. The value of investments and the income derived from investments will fluctuate and can go down as well as up. A loss of principal may occur.
Investment Advisory Services are offered through MBL Wealth, LLC, a Registered Investment Advisor. Securities are offered through M Holdings Securities, Inc., a registered broker/dealer, member FINRA/SIPC. MBL Advisors Inc. is independently owned and operated.
File# 5621883.1
Category: Advanced Market Insights
Good afternoon, the failure of Silicon Valley Bank shook markets last week as investors try to comprehend the uncertainty of this situation for the entire banking industry. It’s a tragic situation for those involved. We have listed several thoughts below.
We are not “bank experts,” nor were most other investors until 48 hours ago. Having said this, our thoughts and interpretation of the situation are that Silicon Valley Bank (“SVB”) failed for a few main reasons.
A. We have noted some more complex details below, but Jim Bianco termed things most concisely in noting that this is “an old fashion 1930’s liquidity crisis.” Bianco elaborates that “too many depositors demanded cash at once (as in right now) and SVB could not convert loans and securities to cash that quickly.”
The fact that billions of dollars can be moved in 24 hours by people from their iPhones has changed “banking” forever and will require regulators to adapt. As we note several more times below, the Fed should act with authority to this situation (e.g., unlimited FDIC insurance like 2008, etc.). Unfortunately they are not set to meet until tomorrow (Monday) mid day.
The additional commentary below gets more into the details of this situation but might be less important than this simplistic take from Bianco Research.
B. SVB has/had a unique client base: VC / start up businesses with high cash burn rates. These businesses were raising massive amounts of capital in 2020 / 2021 when the economy was hot. In turn they were depositing these assets into SVB (& other banks) during this same time frame.
The opposite has been true for the last year. Minimum amounts of outside capital have been invested into these businesses, meanwhile continued high cash burn rates and lack of outside capital infusions have driven steady outflows from deposits from SVB.
C. There is no shortage of commentary noting that SVB exhibited TERRIBLE balance sheet management over the last couple of years. They invested short term liabilities (customer deposits) into long term assets in the form of mortgage backed securities and long term treasury bonds.
This was a profitable trade for these banks in 2020 & 2021 by earning 1% – 2% on these assets while paying 0% on deposits. But since interest rates spiked over the last year, this has meant massive losses, on both their held-to-maturity (HTM) and available-for-sale (AFS) securities portfolios.
But by law, banks can carry these assets at cost, so these losses remain “unrealized.” However, markets are well aware of exactly how many losses exist – even though the banks haven’t marked them yet. It is currently unclear how much hedging of this risk SVB did, other than that it clearly was not enough.
To some extent, all banks are in the business of borrowing short-term deposits and owning assets that are longer term loans. SVB is not alone in this as the banking industry had roughly $15B in unrealized losses in 2021, which was estimated to be $610B of unrealized losses at the end of 2022 (source: Tom Lee & FSInsights).
However, these forces were extreme at SVB, which had the bad fortune of receiving a massive influx of deposits during all time low interest rates (which were invested in low yielding bonds) and having to provide cash rapidly during multi-decade highs in interest rates.
D. One estimate we saw noted that less than 10% of deposits at SVB were FDIC insured. In other words, most accounts had balances well in excess of the FDIC $250k per owner limit. In turn, many SVB depositors withdrew funds immediately as the negative headlines began to cascade after the failure of Silvergate Bank earlier last week.
While not the only cause of the failure, a volatile and concentrated deposit base certainly made the situation more difficult for SVB. Other banks with low levels of FDIC-insured deposits and large unrealized losses (relative to book value) in their HTM and AFS securities portfolios could be the next targets if the Fed doesn’t act with some authority in the very near future (before the end of the weekend would be ideal).
E. We are seeing estimates that SVB customers will ultimately recover somewhere between 80% – 100% of their deposits. Nonetheless, this may take time, and many companies who were SVB customers will have issues in striving to make payroll, among other things next week.
This is different than 2008 in the following senses:
A. Banks are not holding a mountain of bad debt from a credit perspective as they were on 2008. Again, per Jim Bianco, this is a liquidity crisis – not a solvency crisis.
B. There isn’t the same contagion risk through the derivatives markets as there was in 2008. The exposure to the actual bad asset was levered up several times back in 2008. Thankfully there is no door behind the door behind the door this time around. These banks are holding high (credit) quality securities with losses due to a sharp rise in interest rates. This is not good by any means, but not the same as 2008.
C. Banks have been vigorously stress tested for the last 10 – 12 years. Including against another 2008 type scenario.
D. Regulators now openly acknowledge that the biggest banks are “too big to fail” and if anything, they are likely over capitalized. In this regard, systemic risks to the banking system are not the same.
Although there are many differences in the current situation relative to 2008, there is little doubt we are at the point where “things” are starting to “break”. We are not going to get into those details in this note, but this is the eventual result of most interest rate hiking cycles.
The Fed now seems to have backed themselves even further into a corner in the sense that they are not satisfied yet with their fight against inflation, yet at the same time the financial system cannot handle higher interest rates.
We don’t think it would be unreasonable to speculate that the banking system NEEDS lower interest rates, but we emphasize the use of “speculate” in this comment. Government actions always have unintended consequences, and it wouldn’t surprise us if the Fed has just begun to consider the eventual ramifications of the unrealized losses on bank balance sheets as a result of the Fed’s historically aggressive (and largely appropriate) interest rate hiking cycle.
Michael Hartnett from Bank of America Global Research has a great phrase – “markets panic until policy makers panic.” On Friday he wrote that investors will need to be ready to buy risk assets once the Fed panics – but nobody has any idea right now if that is a week away or a year away.
Along with the other secular forces already in place, this only furthers the thesis that inflation will remain sticky to the upside as the Fed will (eventually) ultimately prioritize the health of our banking system (if necessary) above either of their two stated mandates (price stability & full employment).
Although we should mention that lower bank deposits and the main funding source to Silicon Valley possibly not existing anymore would be disinflationary.
Markets will likely move big one way or another on Monday / next week. A lot of this will likely depend on the Fed’s and the regulators’ responses in the days ahead. Little response will likely mean other banks (low FDIC insurance on deposits & large unrealized losses relative to shareholder equity) are targeted next week.
Finally, banks are going to have to start to pay reasonable rates of interest on deposits in order to prevent continued outflows. This will be a direct dent to bank profitability (lower net interest margins), which is why banks have been resistant to do this as of yet.
The banking world changed dramatically last week, and it will likely take time for participants (banks, regulators, investors, customers, etc.) to adapt.
Within our clients’ equity portfolios, we remain relatively defensively positioned as we have for the last two years. Yields dropped sharply last week (bonds up), and we would expect this dynamic to continue if banking sector / economic concerns continue to be top of mind for investors (yields down is also good for bank balance sheets in reducing their unrealized losses).
We will be in touch as we have additional thoughts and information. We are honored to serve you during these challenging times.
Sincerely,
Brian Gift, CFA
The U.S. Government did step in late Sunday (after our initial update) with assurances to depositors at SVB, and implicitly other banks, that their deposits are safe.
The first step was announcing that SVB and SBNY depositors were going to have their deposits fully guaranteed with immediate access. This removed significant uncertainty for depositors with balances above FDIC insurance limits.
In addition, the Federal Reserve announced an additional funding option for banks through the creation of the Bank Term Funding Program (BTFP). The new program provides banks with access to additional liquidity through pledging their underwater securities at full par value.
Taken together these measures are aimed to:
(i) reduce concerns of depositors with balances above FDIC limits to prevent another swift bank run and
(ii) provide banks with embedded losses the ability to meet incremental deposit redemptions without realizing significant losses.
While this does not fully alleviate the pressure the past 12 months of rate hikes have put on the banking sector, we believe these were important steps in reducing the risk to depositors of other financial institutions.
This material is intended for information purposes only and should not be construed as legal or tax advice and is not intended to replace the advice of a qualified attorney, tax advisor, or plan provider. Investments in securities involve risks, including the possible loss of principal. When redeemed, shares may be worth more or less than their original value.
The Standard & Poor’s 500 Index (S&P 500 TR) is an index of 500 stocks chosen for market size, liquidity and industry grouping, among other factors. The S&P 500 is designed to be a leading indicator of U.S. equities and is meant to reflect the risk/return characteristics of the large cap universe.
This information has been taken from sources we believe to be reliable but there is no guarantee as to its accuracy. This material is not intended to present an opinion on legal or tax matters. Please consult with your attorney or tax advisor as applicable.
# 5515124.2
Category: Advanced Market Insights
Date: 2023
Author: Brian Gift, CFA — Chief Investment Officer — 704-335-4518
Every December Wall Street strategists partake in their annual ritual of forecasting where the S&P 500 will be a year from now. To be fair, this is somewhat of a thankless exercise as capital markets simply do not allow investors to be this precise. Most strategists were too conservative with their S&P 500 price targets in 2017, 2019, 2020 & 2021. Conversely, the consensus was overly optimistic in 2018 and flat out off the mark in 2022. We can’t help but point out the irony of 2020 when the global economy briefly experienced an economic depression during the second quarter due to a black swan event, yet most investors were too conservative in their forecasts for the year. In short, there will always be demand for people to predict the future, but few investors would be successful over the long term if their success was solely dependent on the accuracy of various forecasts.
In the pages to follow we have listed 23 viewpoints / themes / ideas around which we either hold a relatively high degree of conviction and / or believe are noteworthy observations for investors. We often state that as investors, we are humble and disciplined if we are nothing else. So of course, an S&P 500 target is not included anywhere in this outlook. Nonetheless we believe these themes will be useful in helping investors formulate how they may want to position portfolios on a tactical basis moving into next year. We have intentionally tried to keep most of our commentary somewhat brief, but we always enjoy discussing these topics in further detail.
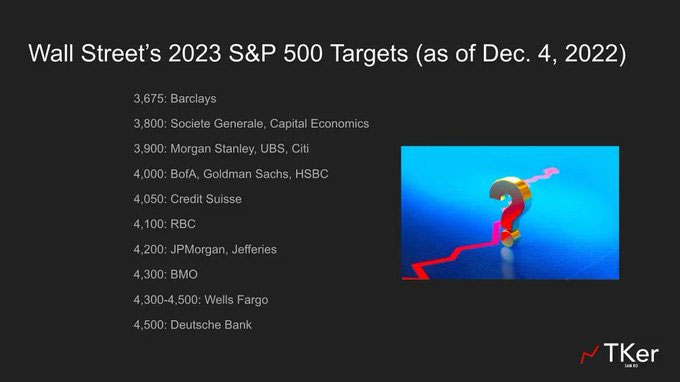
According to our analysis, the last time the average S&P 500 price target came within 10% of actual returns (in either direction) was 2016.
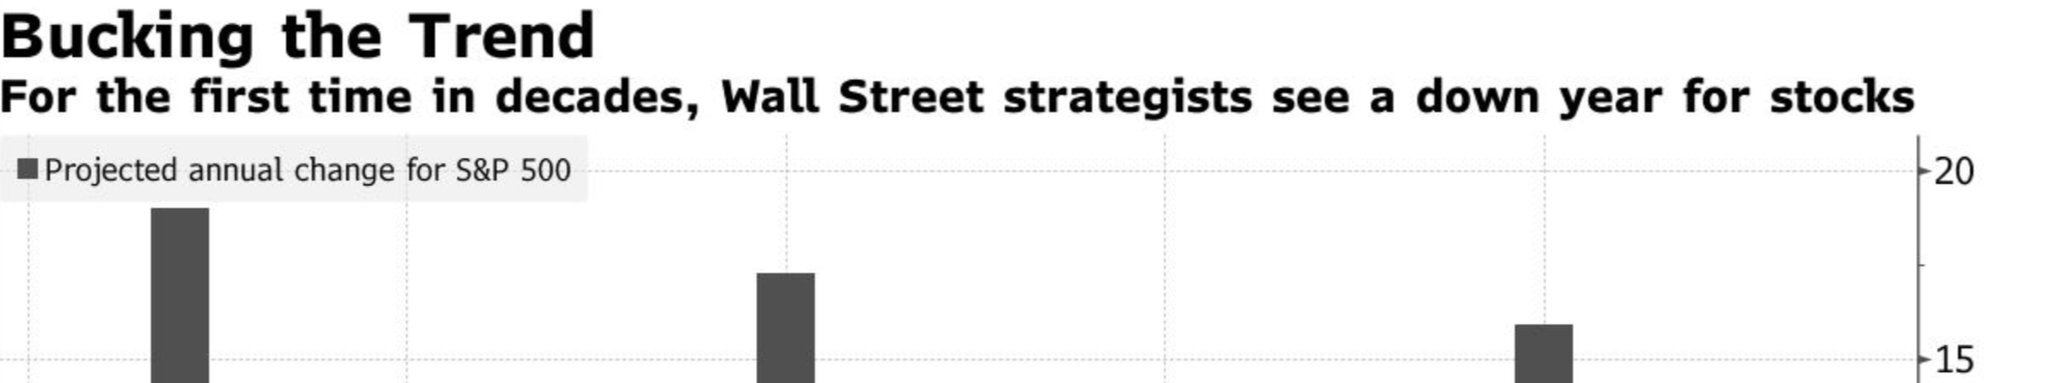
Understanding where the consensus lies is always an important aspect in formulating investment viewpoints. While we readily acknowledge that sometimes “the consensus” is correct, the vast majority of year ahead outlooks are predicting a “difficult” first half of the year, followed by a market recovery in the back half of the year. We believe the forecast for a bad 1H and good 2H is extremely consensus, and thus investors need to be on guard against this thinking. A stock market rally during the first quarter of 2023 could force many investors into chasing stocks higher. According to the Bank of America Global Fund Manager Survey, investors are more underweight equities today than they have been at any point since 2009.
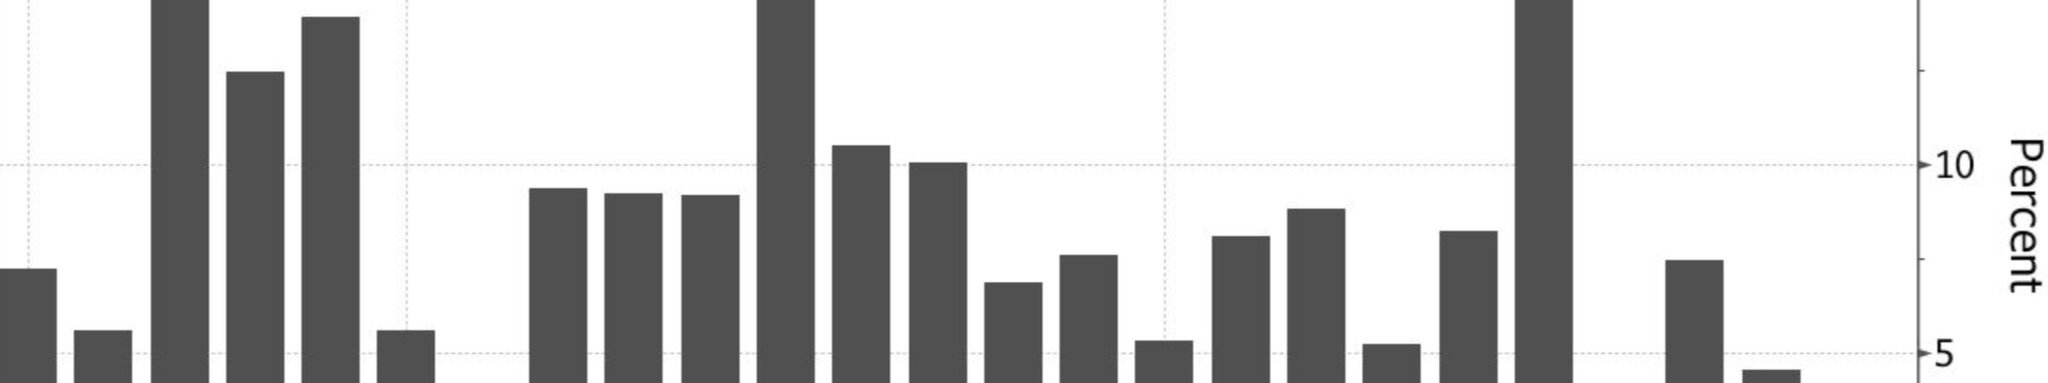
Savita Subramanian runs the Equity & Quant Strategy group for BofA Global Research and annually publishes a forecast for what investors should expect on average for S&P 500 returns over the next decade. The chart below shows that her model has an impressive historical track record. Savita’s current forecast is for 5% annual price returns which would put the S&P 500 above 6000 in 2032.
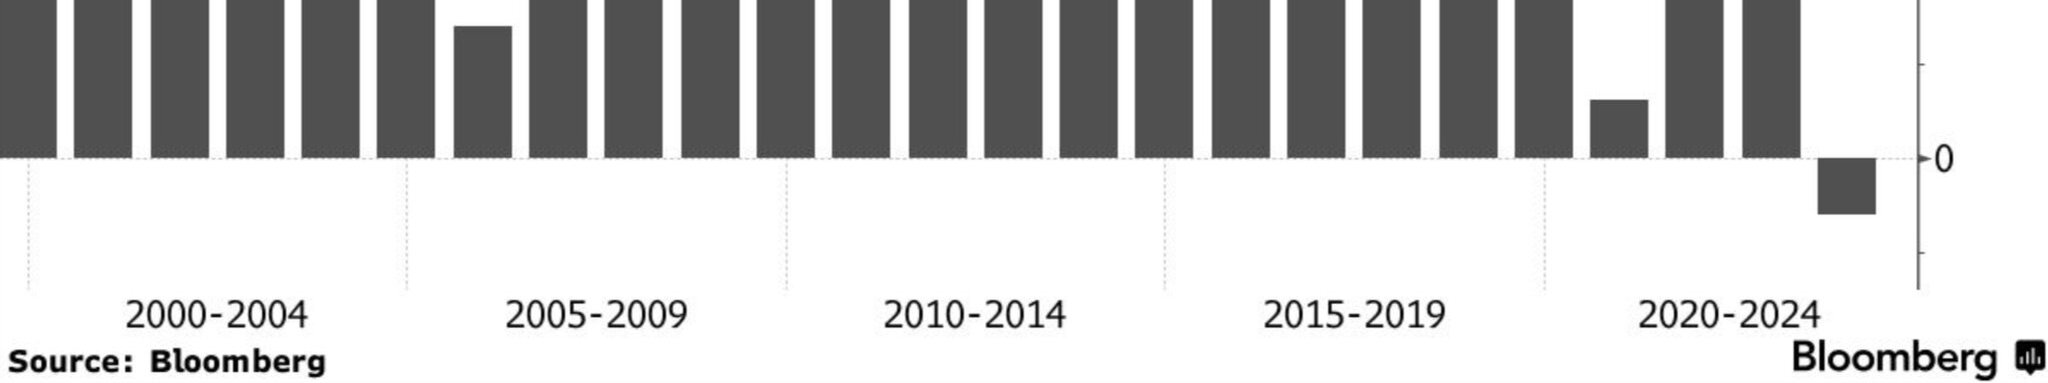
It is important to note that her forecast excludes dividend yield. If the dividend yields are added to the price returns, Savita’s forecast means the S&P would yield investors with 6.5% – 7% average annual total returns over the next decade. While humility dictates our reticence to make such an explicit forecast, we strongly agree with this narrative of returns which are below long-term historical average (9% +/-), but still attractive relative to bonds, for US Large Cap equities over the next ten years.
This will be an important concept to embrace since most investors agree that market volatility will likely remain elevated for the foreseeable future. The opposite is also true, if markets were to move substantially higher without fundamental justification / because of multiple expansion, investors may need to decrease their future expected returns accordingly.
Yield curves are deeply inverted, Manufacturing PMI’s are decelerating, recently entering restrictive territory, the housing market is cooling at a historic pace, and US Leading Economic Indicators are negative on a year over year basis. Collectively these indicators have a strong track record of signaling recessions. Therefore, we believe the probabilities for a recession are increasingly elevated since our last writings in September.
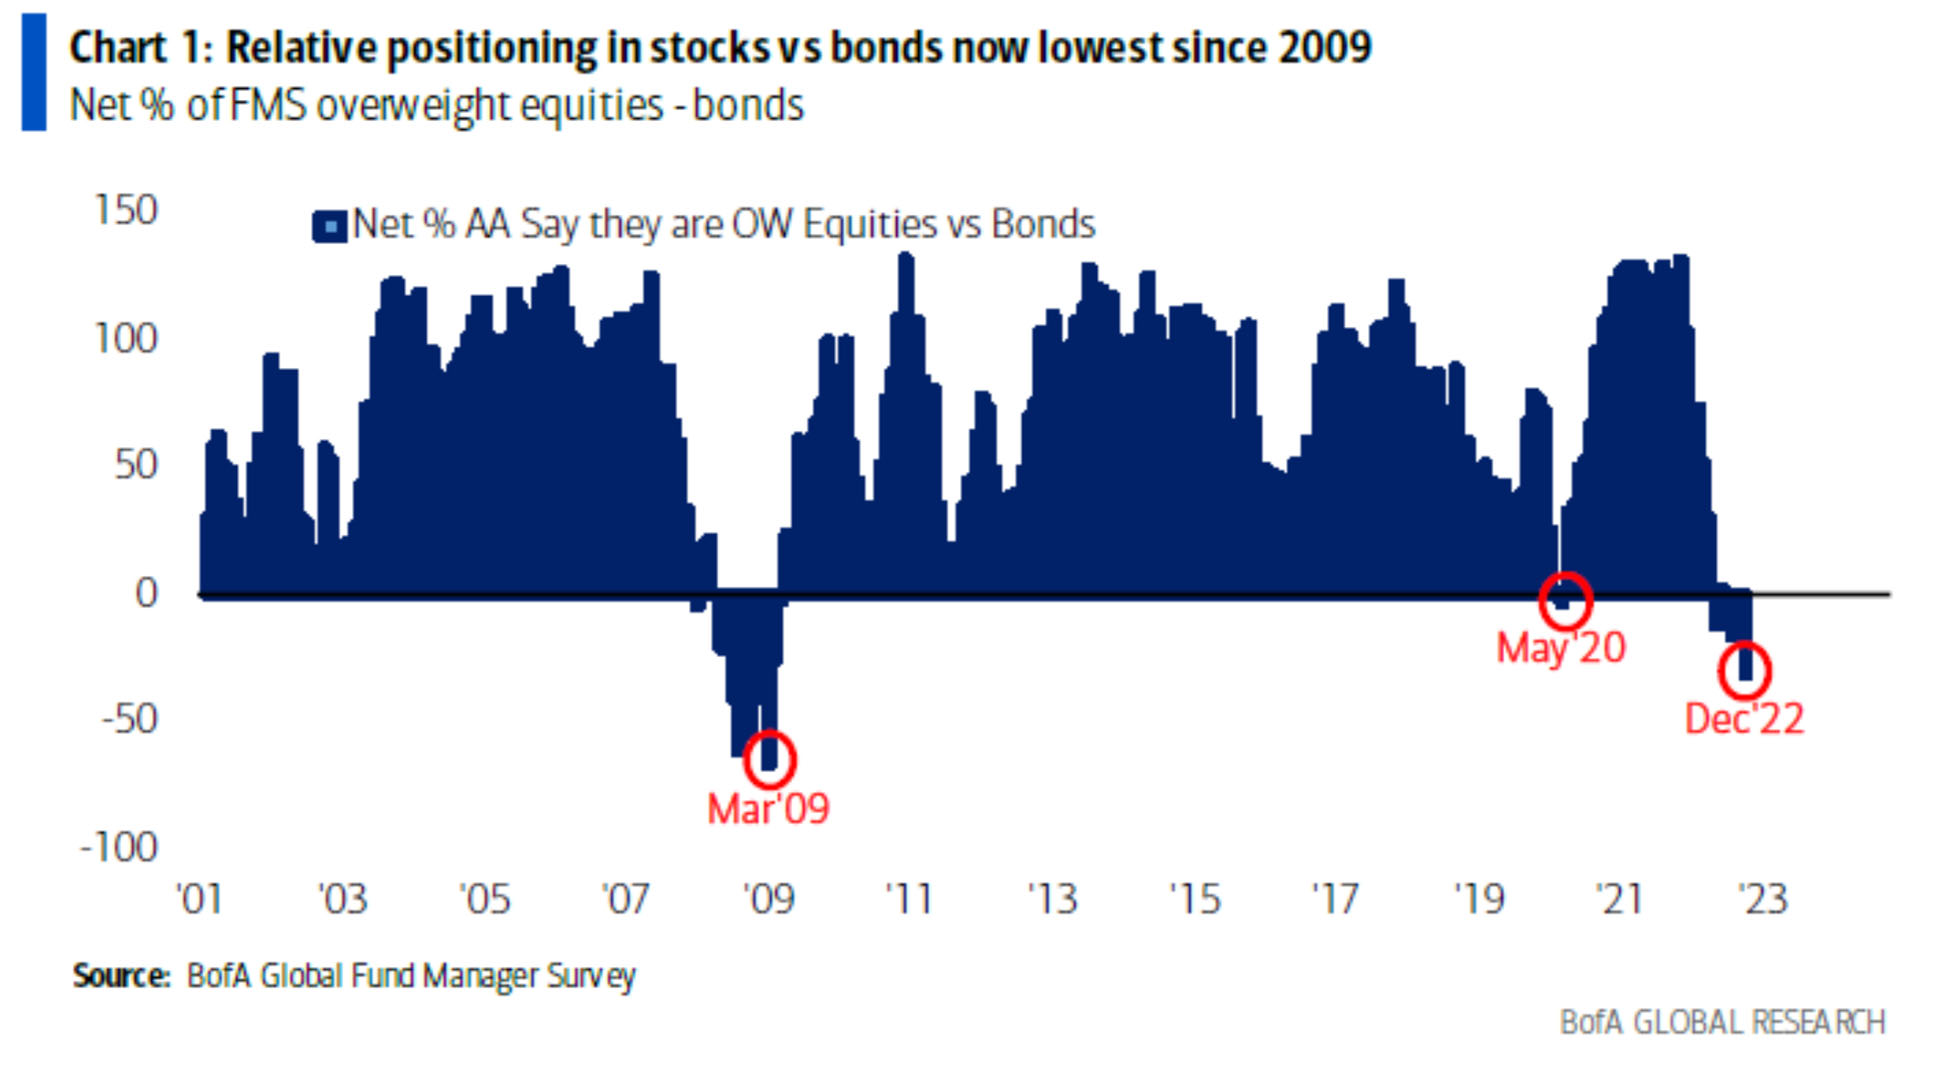
David Zervos of Jefferies and Barry Knapp of Ironsides Macroeconomics are both brilliant economists. They also share the rare traits of being truly original thinkers and unafraid to challenge the consensus. While most economists seem to be using a traditional playbook in forecasting a recession (or not) for 2023, Zervos and Knapp share some fascinating opinions on what they believe is in store for the US economy.
Their main point is that a recession in which real GDP contracts, but nominal growth stays positive is a very different scenario than the deflationary busts of 2001 and 2008. When deflation becomes an issue, the Fed cuts rates to 0% and possibly starts a QE program, corporate earnings collapse, and unemployment spikes. A 1970’s style recession where nominal growth stays elevated is far from an optimal environment but could be less strenuous on corporate profits vs. deflationary economic contractions.
S&P 500 Corrections & Bear Markets 1975 – 1982.
Recessions are highlighted in grey
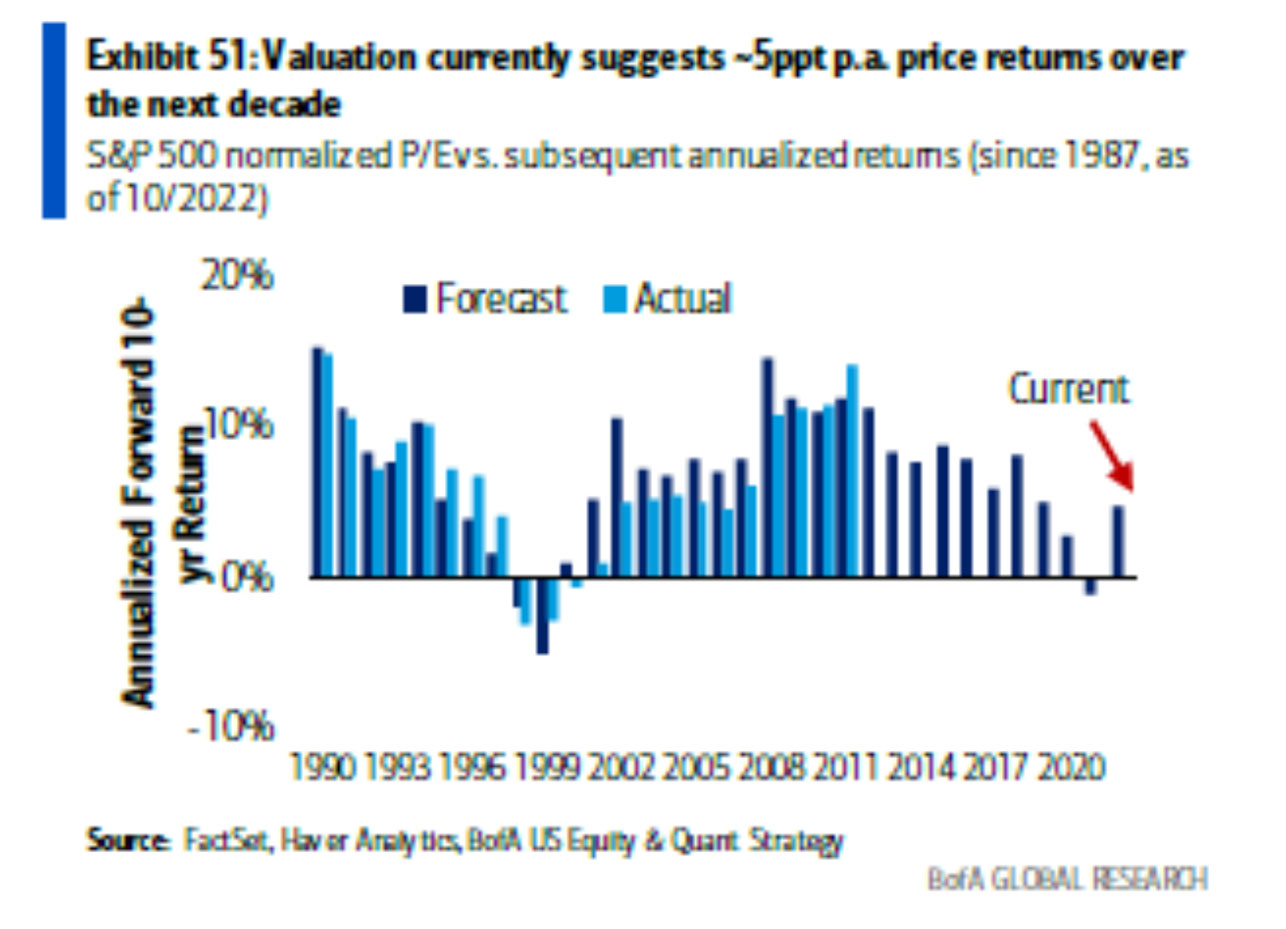
| Peak | Trough | Drawdown | # of Days |
|---|---|---|---|
| 7/15/1975 | 9/16/1975 | -14.10% | 63 |
| 9/21/1976 | 3/6/1978 | -19.40% | 531 |
| 9/12/1976 | 3/6/1978 | -19.40% | 63 |
| 10/5/1979 | 11/7/1979 | -10.20% | 33 |
| 2/13/1980 | 3/27/1980 | -17.10% | 43 |
| 11/28/1980 | 8/12/1982 | -27.10% | 662 |
Myriad factors may have to line up in order for this to come to fruition, but Citi, Schwab, Goldman Sachs and Dr. Ed Yardeni are all using this as their base case scenario. Many of these research firms are discussing a “rolling recession” outcome in which various portions of the economy dip into and out of recession, but the entire economy never actually contracts in unison. Think about the housing and durable goods boom in 2020 & 2021 while the services sectors came to a grinding halt. The opposite has happened to some degree in the back half of 2022.
Don Rissmiller also points out that in order for a soft(ish) landing to occur, the Fed would need to be tolerant of inflation around 3% +/- rather than their 2.0% target. In addition, most of the damage done to the labor market would need to happen in the form of job openings being reduced rather than broad job losses.
Don Rissmiller from Strategas Research Partners describes the purpose and effects of monetary policy more concisely than anyone else we know. He notes that monetary policy doesn’t change long term potential growth rates in an economy. However monetary policy does effectively move growth around in time – pulling future growth forward with easy policy (2020) and constraining growth below what is otherwise capable with restrictive policy. The Fed is not shy about their desires for a restrictive policy stance, and a 4.5% Federal Funds Rate certainly achieves this goal vs. their estimates for a long run neutral Fed Funds Rate of 2% – 3%.
Of course this was more factual prior to the Q4 rally across most asset classes. But January 2022 – September 2022 was the 14th worst 9-month period for US equities since 1971. Forward returns and positive hit rates are very strong following these historically bad periods.
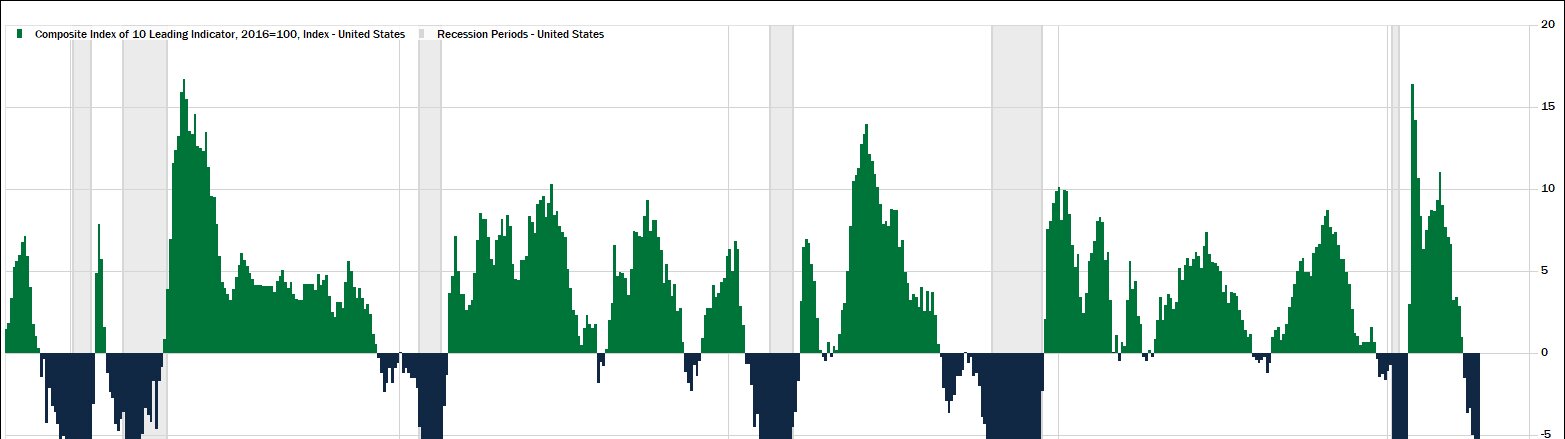
We believe peak inflation and maximum Fed hawkishness are behind us and the November CPI report serves as confirmation that inflation is going to fall rather sharply in the months to come, possibly to the 4% +/- level by late spring. In other words, the inflation / interest rate bear market of 2022 has likely concluded. However, risks are plentiful for a “second act” in this bear market due to a recession and a contraction in corporate earnings.
The chart below from Strategas Research Partners shows us a couple of interesting observations. First, most of the time economic data doesn’t have much of a statistical impact on forward returns for US stocks. The exception to this statement is that 6-month forward returns tend to be the worst, after the strongest PMI (manufacturing activity) readings. And 6-month forward returns tend to be the best, after the weakest PMI readings. We are currently in the second decile with no evidence of economic growth stabilizing in the near future.
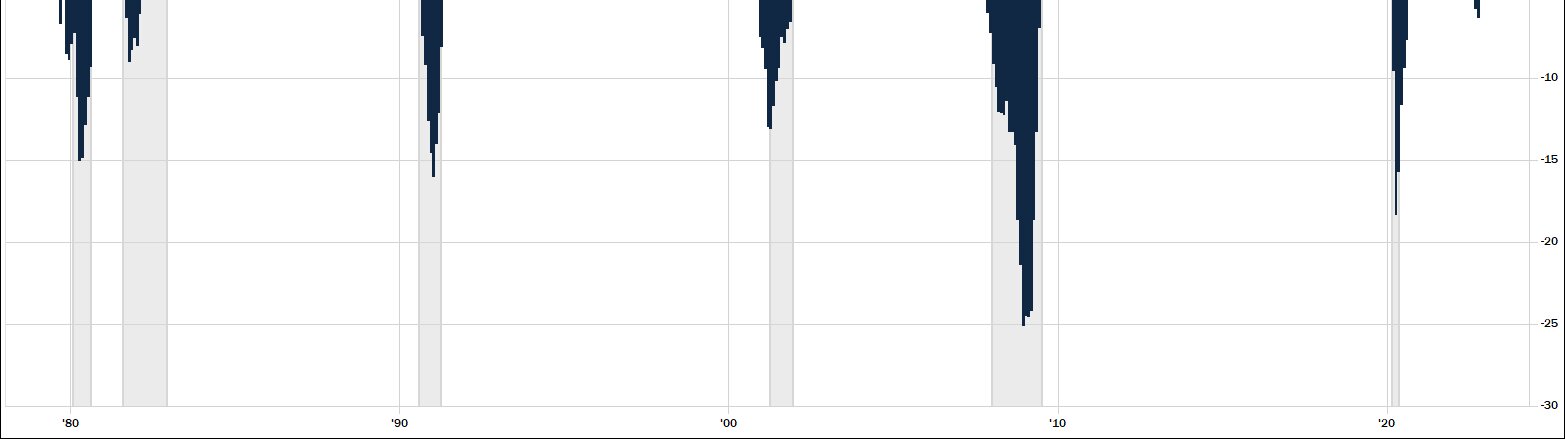
At the market lows in October, the S&P 500 was down around -26% on a closing basis. Historically, forward returns are very strong when you buy the S&P 500 down -25%, even when the market continues to go down further, which in a couple of historical instances was substantially further. To be clear, the forward returns listed in the chart below are from buying as soon as the S&P 500 hits down -25%, not from the eventual market lows.
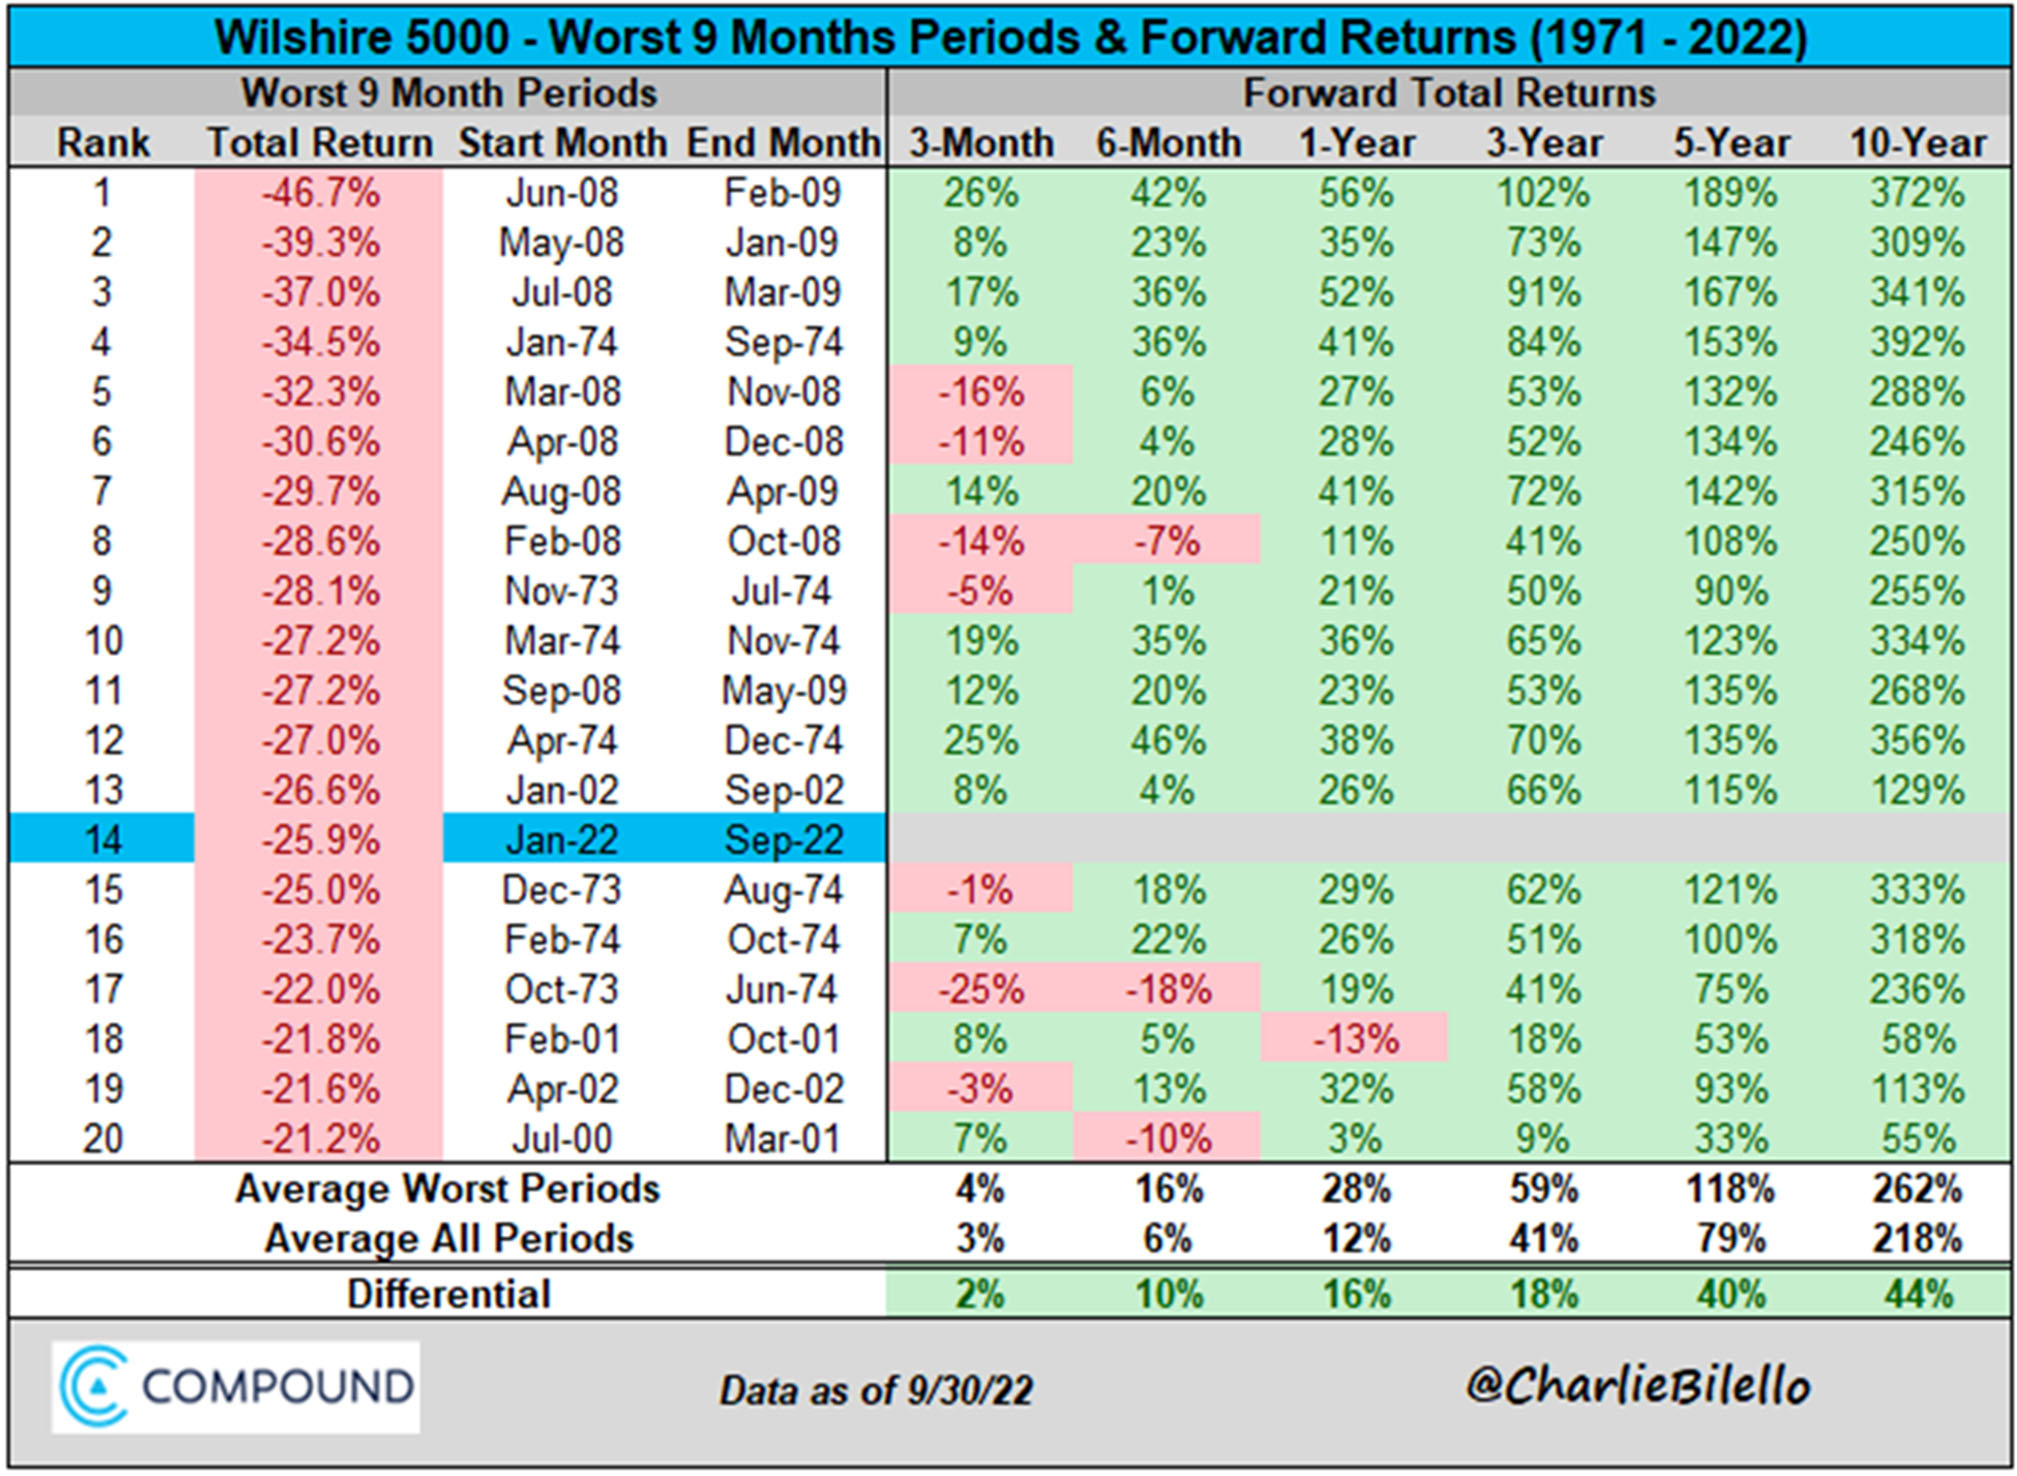
This is counterintuitive to most investors and is part of the reason why the initial stages of a rally coming out of a bear market are rarely trusted. But this serves as a great reminder that stocks are a leading indicator and usually bottom when things go from “awful” to “really bad” and sellers become exhausted.
Equities Have Bottomed Before EPS in 13 / 16 Recessionary Bear Markets
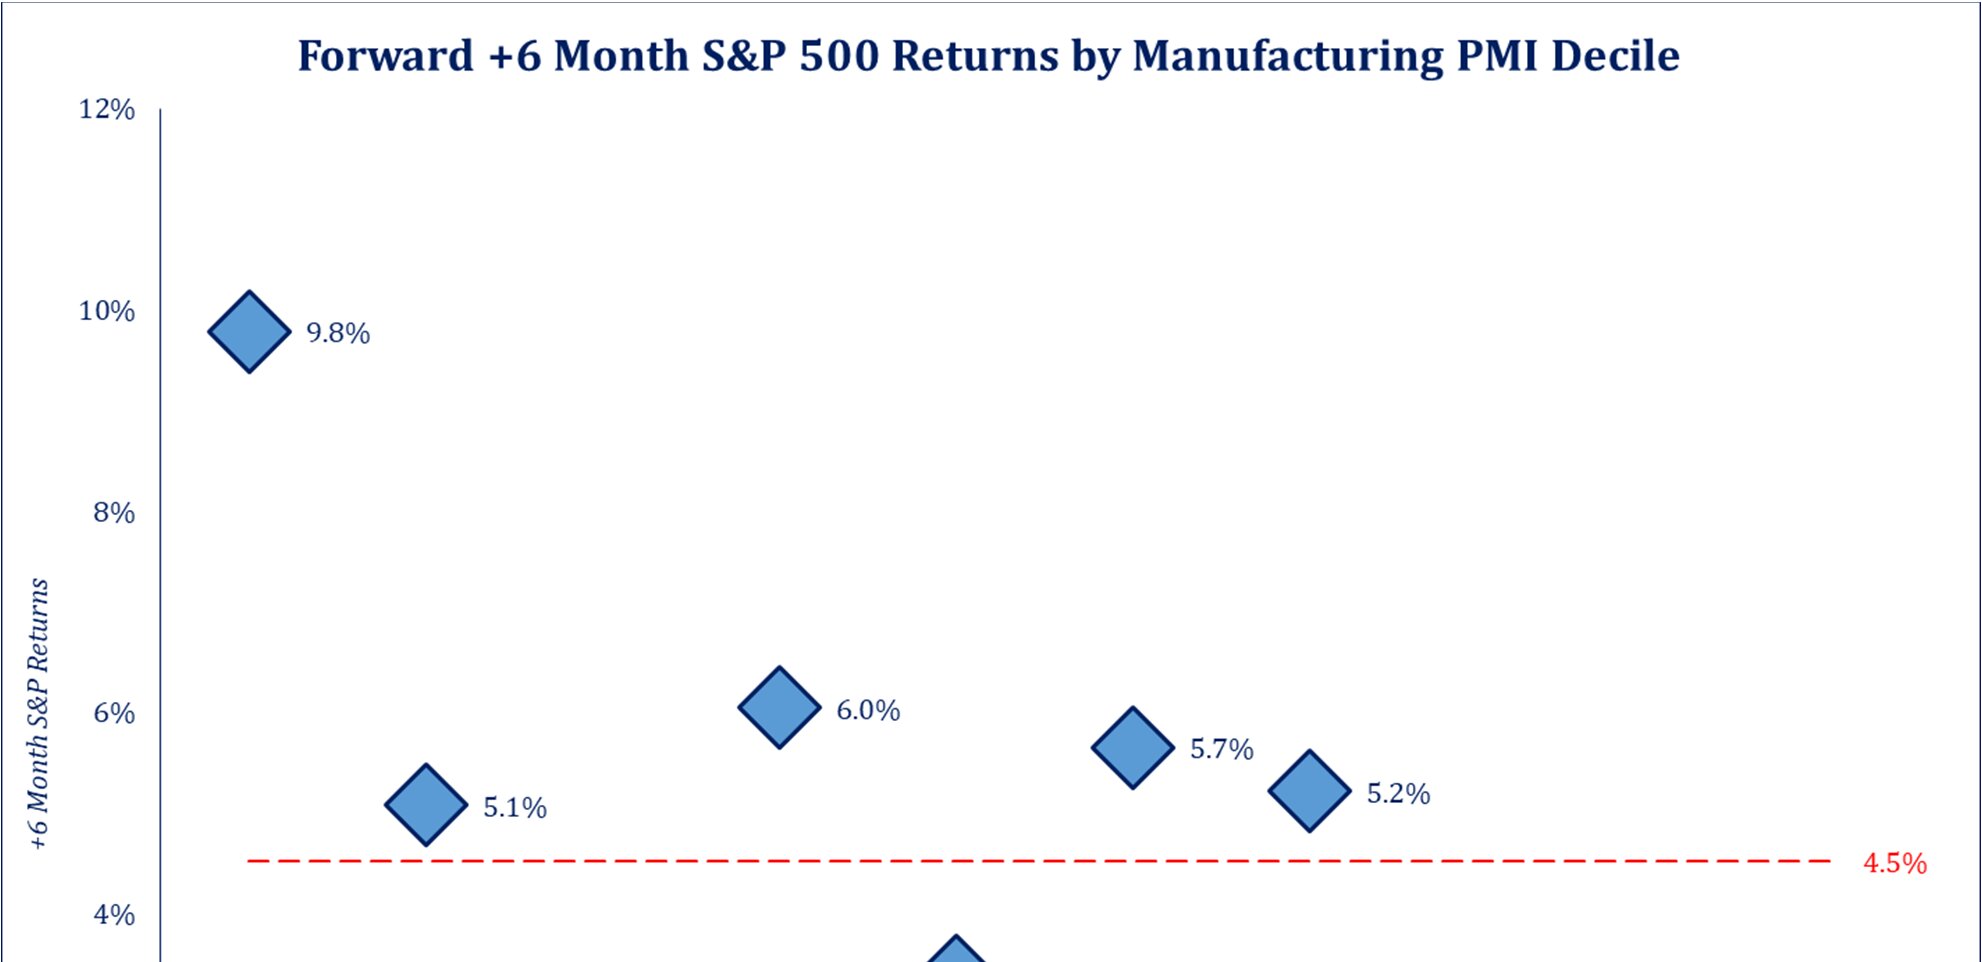
It is certainly possible that we are “due” for two consecutive negative years for US equity markets. But statistically, it doesn’t happen often.
S&P 500 Annual Returns (price only)
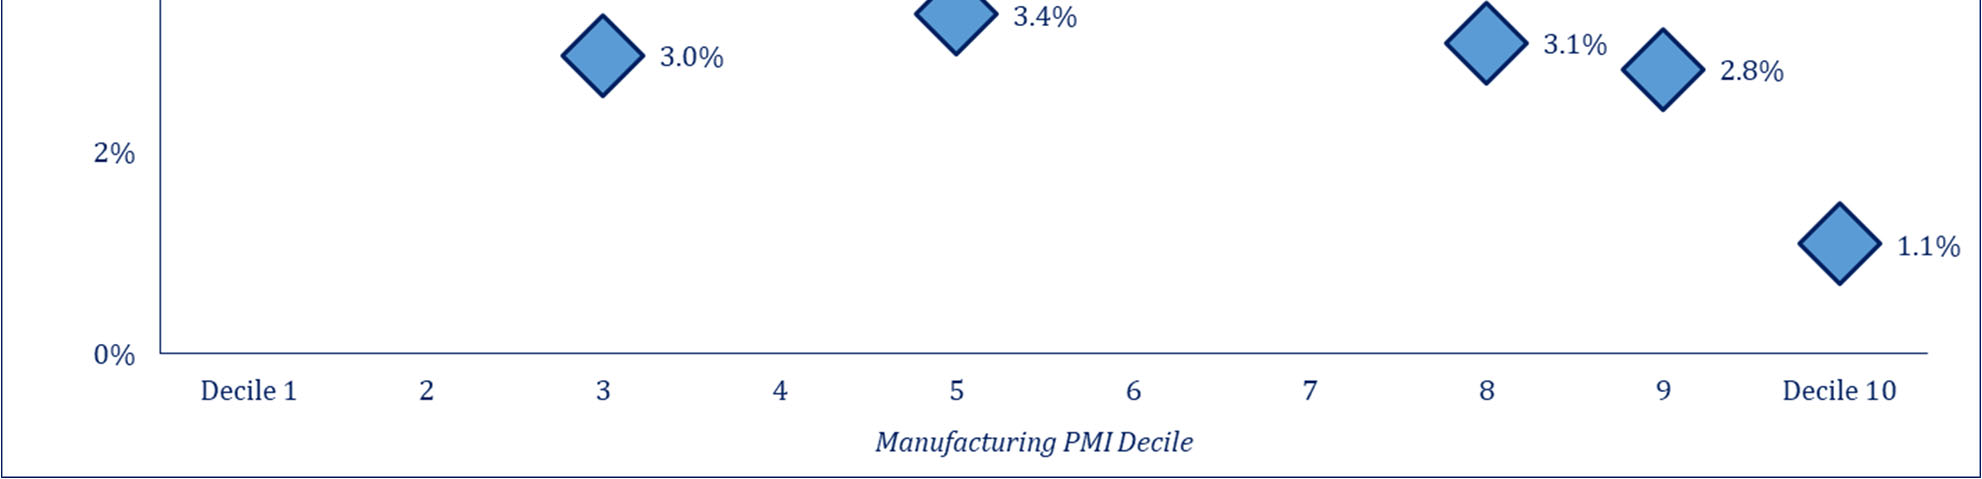
2022 was a historically poor year for bond investors, so improvement over this threshold is a low bar. Having said this, we are willing to take things a step further to say that probabilities highly favor positive returns from investment grade bonds next year given the level of yields on high quality fixed income securities. US Treasury bonds with maturities of 10 years or less are trading their highest yields since 2007 / 2008 (source: MBL Advisors & FactSet). It was a painful process for bond investors to get to where we are now. But we finally have an interest rate environment which we have long awaited, giving investors the ability to achieve modest returns from the “safe” portion of their portfolio again.
Peak globalization, a shrinking labor force, global shortages of traditional energy, clean energy initiatives and an undersupply of single-family homes are some of the main drivers which could keep inflation well above the Fed’s stated 2.0% inflation target for years to come.
2009 – 2021 will forever be remembered as the QE Era for investors, which in our minds is somewhat synonymous to the steroid era in baseball. Certain factors simply were not in their natural state of being during this period of time, and this had broad based ramifications across capital markets. The largest factor was the artificial suppression to the cost of money, eventually leading to misallocation of capital and excessive risk taking. Therefore, as purists at heart, we welcome the reversion to fundamentals mattering as they should again.
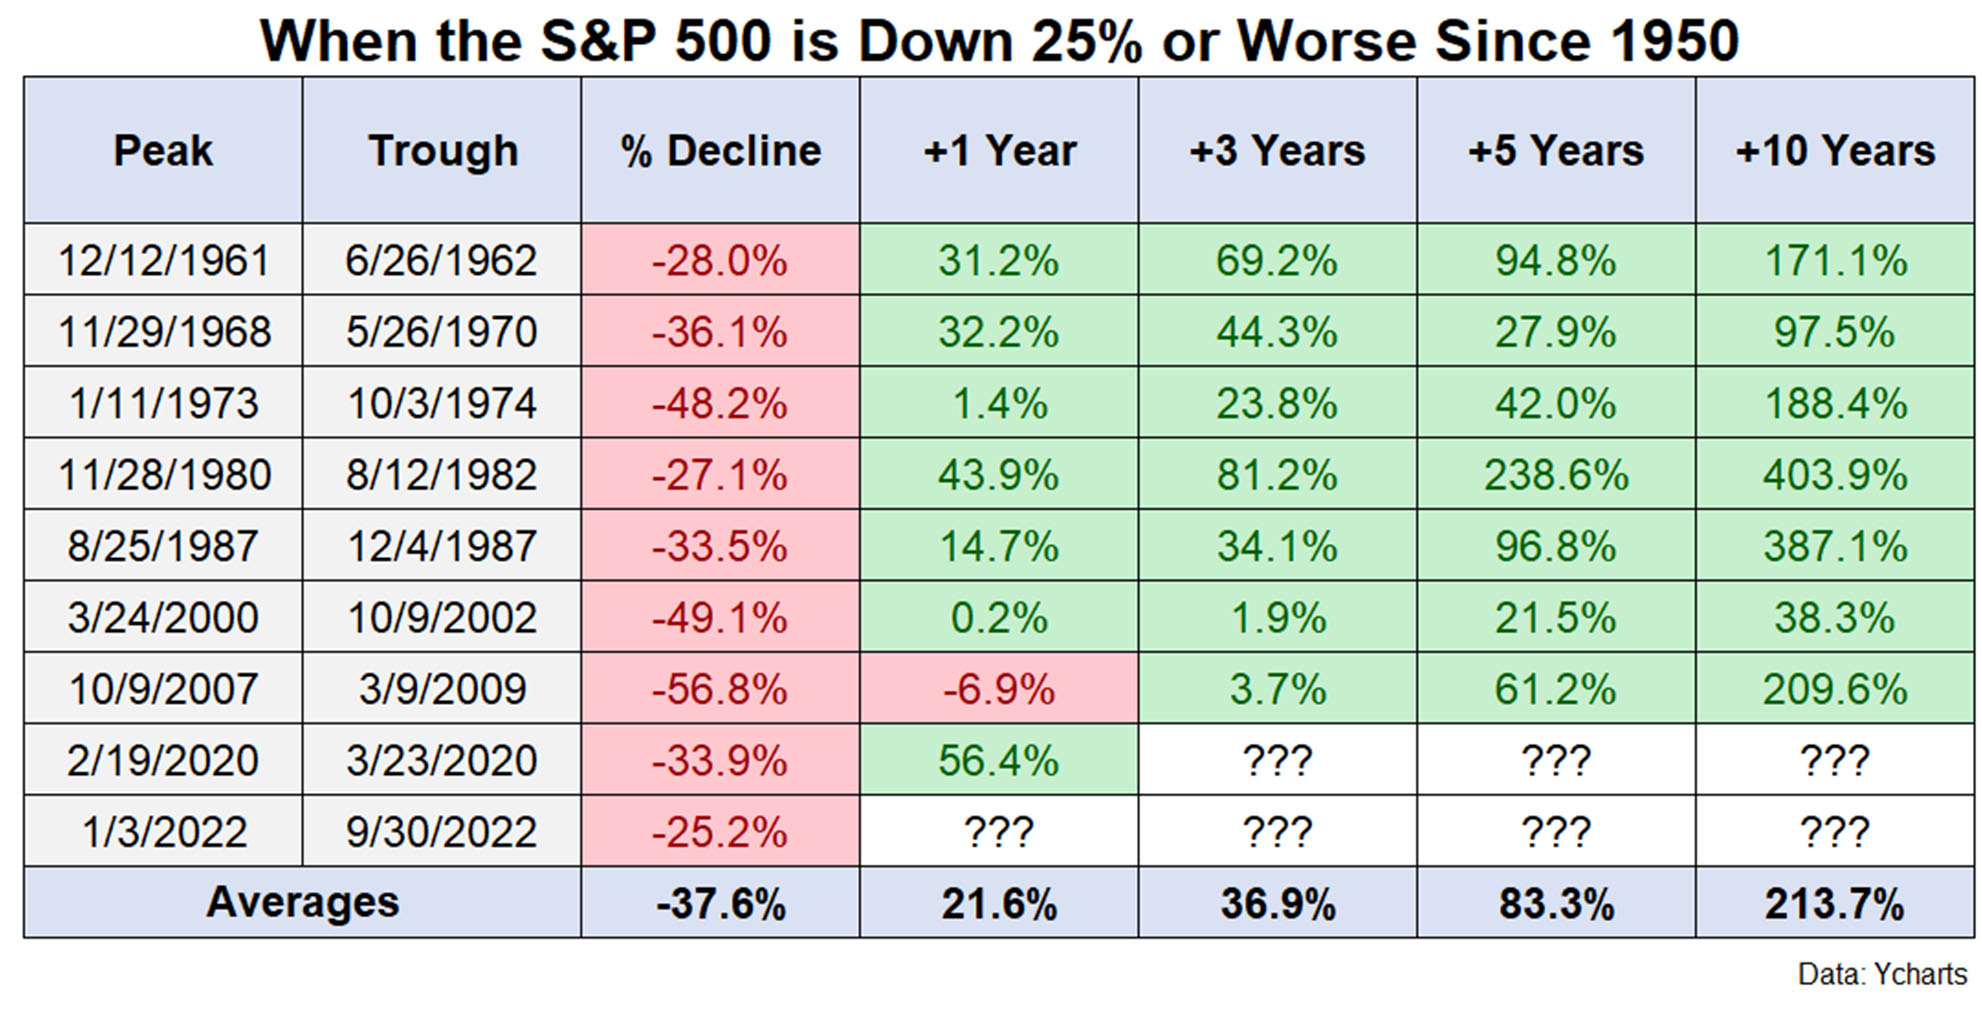
This has certainly been true in 2022 despite a stronger US dollar, until Q4 of this year. We continue to believe that the leaders of the next bull market will be asset classes / sectors other than the US Mega Cap Growth stocks which were the undisputed leaders of the last bull market.
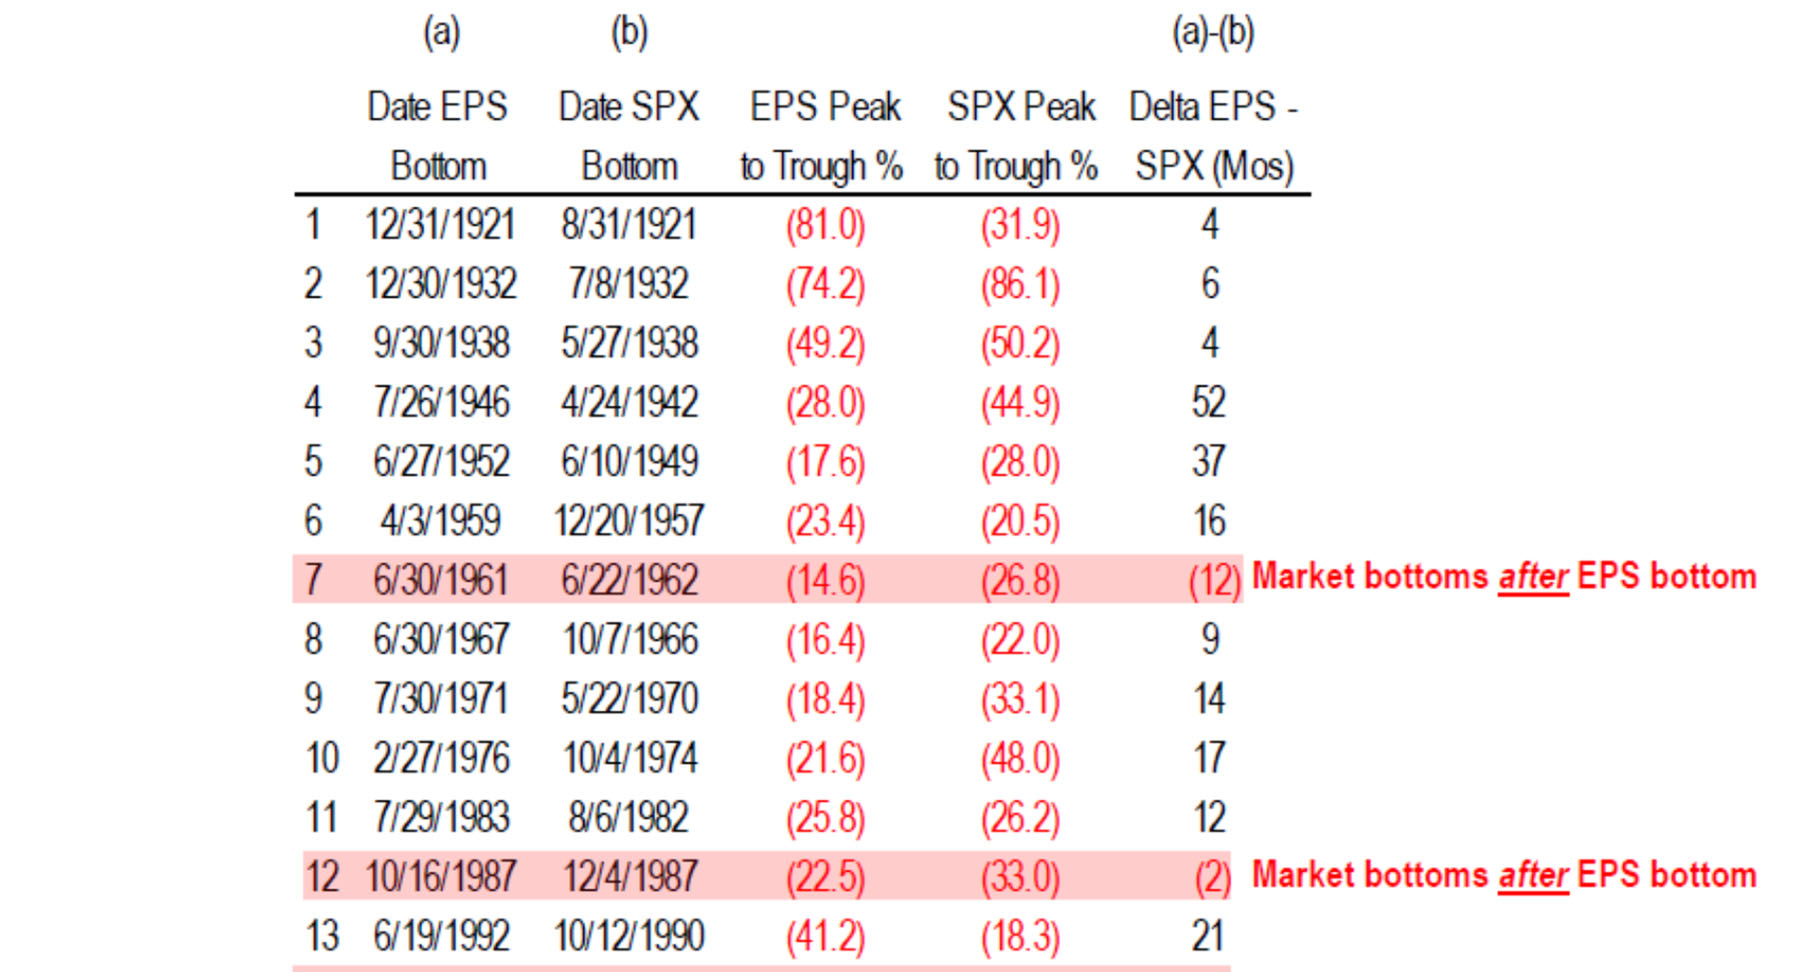
According to the chart below from Strategas Research Partners, dividends have contributed 59.4% of S&P 500 total returns since 1930. This is in comparison to dividends accounting for roughly 26% of total returns for the S&P 500 during the 1990’s and 2010’s. Although dividend yields are lower today than they have been historically, we strongly believe that dividends will make up a much higher percentage of total returns in the years ahead relative to the past decade.
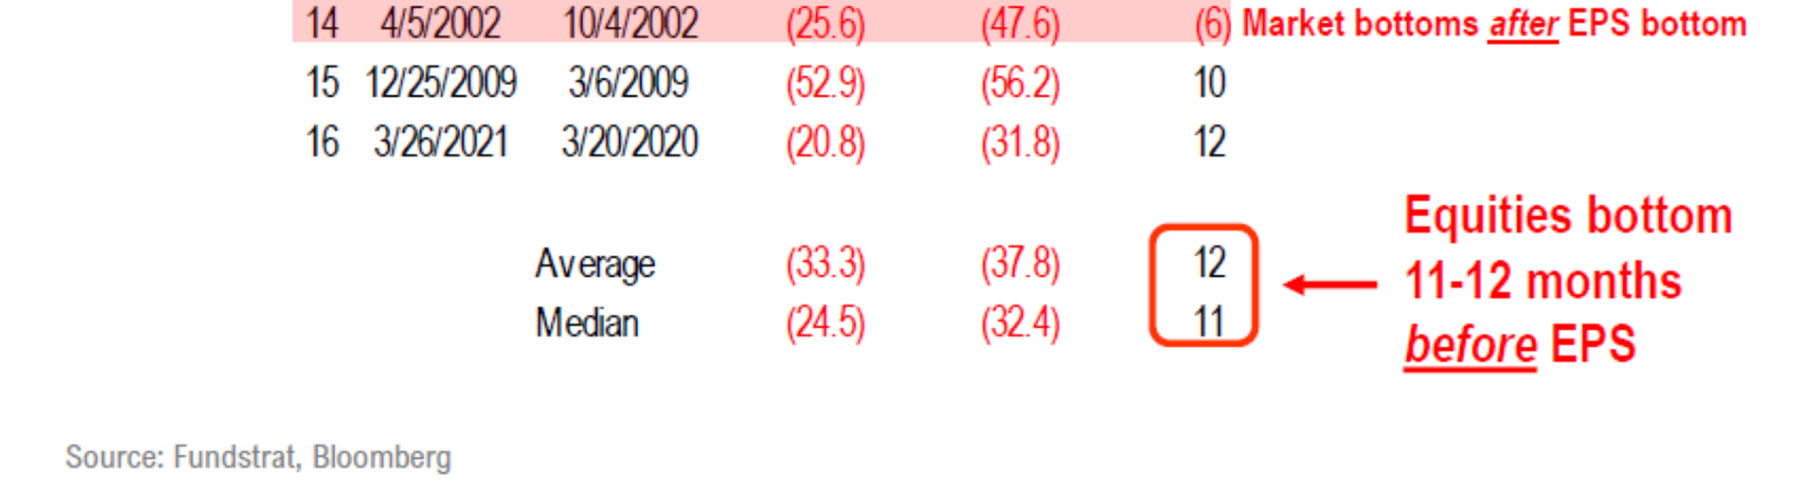
A client forwarded us a note from Tony Passquariello from Goldman Sachs in which he listed several interesting points. Our favorite was as follows:
if you went back to 1945 … and invested $1,000 in S&P … you would have $3mm today (a return of 3000x). if that money was only invested from May through October, you would have $10,000 today (a return of 10x). if that money was only invested from November through April, you would have $300,000 today (a return of 300x). this illustrates both the influence of the “best six months” seasonal, as well as the immense power of compounding. source: Ben Snider and Ryan Hammond, GIR.
US equity market valuations are back into the realm of “normal,” and if we exclude the top 50 largest constituents in the S&P 500, valuations are in line if not below longer-term averages for many stocks. In addition, debt markets are offering investors the opportunity to achieve fairly low risk, mid-single digit returns from high quality fixed income securities for the first time in years.
Shiller P/E Ratio (green) & US Treasury 10 Year Bond Yield (blue)
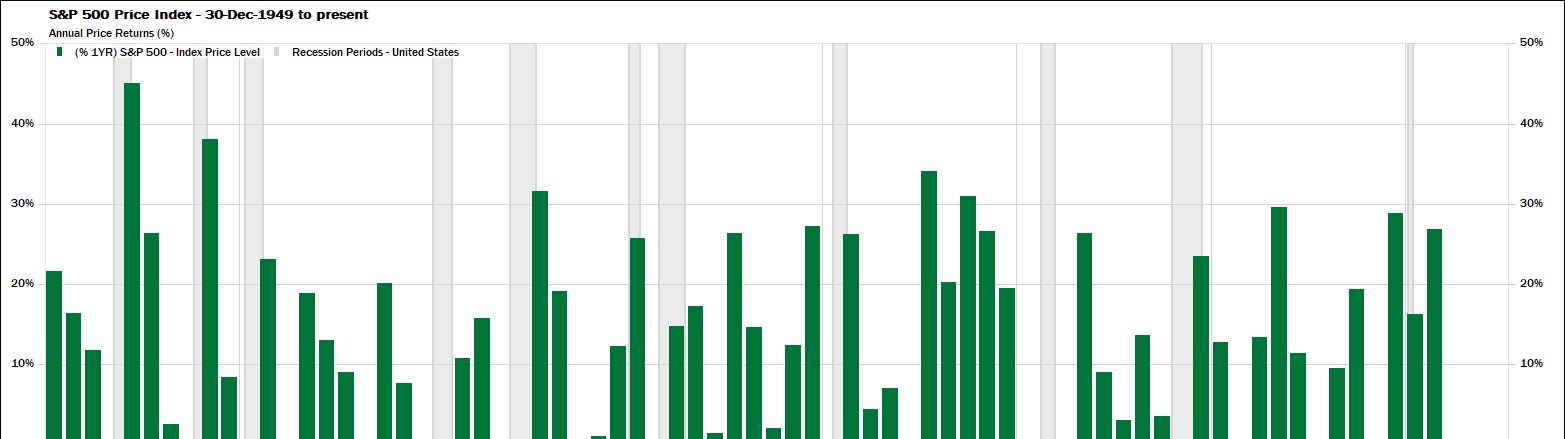
Markets don’t always “give” great opportunities to investors, and investors may not always like the circumstances with which markets are presenting them. Having said this, the main theme of our Investment Strategy Committee meetings for the last several months has been to “take what the market gives us”. This same phrase is also the punchline to this entire strategy outlook and will be the foundation for our tactical investment decisions as we move into 2023.
The irony of this mentality is that we are stressing the fact that “we don’t know, what we don’t know.” Conversely, one thing we are keeping at the top of our minds is that the “pitches” tend to be a little “fatter” for investors during times of financial distress, which allows us the potential to be patient in waiting for high probability opportunities, when considering a 1 – 3-year investment time horizon.
Congruent with many of the items we have mentioned up to this point, the largest theme we are currently striving to accentuate within portfolios is to continue to tilt towards “yield” and “quality” across both stocks and bonds. This allows us to be “paid to wait” to some degree while we monitor markets for the possibility of some especially discernable opportunities.
15 out of 17 Wall Street strategists have year-end S&P 500 targets between 3800 – 4300 for 2023. Coincidence or not, the S&P 500 has spent most of the last 9 months trading within this range. We will be monitoring a confluence of other factors, which will serve as our predominate indicators in evaluating points in time when we want to be rebalancing portfolios, but slightly below the bottom end of this range and towards the top end of this range likely serve decent starting points within this framework.
In closing we are going to republish a few items which we wrote about in our May 2022 Investment Strategy Outlook.
The closest thing investors can realistically have to an investing superpower is to have conviction in their long-term investment strategy during times of market distress.
Being a “long term investor” when markets are going up is the easy part of the investment equation. The more important aspect of being a long-term investor is sticking to this mold when markets are going down and investing becomes more challenging. Successful long-term investing requires us to be uncomfortable in the short term on a more frequent basis than we would ideally like to be. But history tells us that markets reward investors who can successfully manage through these inevitable shorter-term obstacles.
MBL Advisors wishes you and your families a Merry Christmas and wonderful holiday season.
Sincerely,
Brian Gift, CFA
Chief Investment Officer
MBL Advisors
Bob Farrell is a legendary Merrill Lynch strategist who published his timeless list of 10 investing rules several decades ago, a version of which can be found here https://www.investopedia.com/articles/fundamental-analysis/09/market-investor-axioms.asp.
It seemed some investors believed these rules were no longer as relevant as they once were when they didn’t hold true to form during the extremely abnormal bear market and subsequent recovery in 2020 and 2021. However, all of these rules seem especially pertinent today as we proceed thorough this more traditional bear market. We have written about Bob Farrell’s rules on multiple occasions in the past. But their timelessness and truth always amaze us each time we observe them.
Disclosures:
* This report was prepared by MBL Wealth, LLC and reflects the current opinion of the firm, which may change without notice. This report is for informational purposes only and is not intended to replace the advice of a qualified professional. Nothing contained herein should be considered as investment advice or a recommendation or solicitation for the purchase or sale of any security or other investment. Opinions contained herein should not be interpreted as a forecast of future events or a guarantee of future results. Different types of investments involve varying degrees of risk, and there can be no assurance that any specific investment will either be suitable or profitable for a client’s portfolio. Economic factors, market conditions, and investment strategies will affect the performance of any portfolio and there are no assurances that it will match or outperform any particular benchmark. Investments in securities involve risks, including the possible loss of principal. When redeemed, shares may be worth more or less than their original value.
* The Standard & Poor’s 500 Index (S&P 500 TR) is an index of 500 stocks chosen for market size, liquidity and industry grouping, among other factors. The S&P 500 is meant to reflect the risk /return characteristics of the large cap universe. The indices referenced herein have been selected because they are well known, easily recognized by investors, and reflect those indices that the Investment Manager believes, in part based on industry practice, provide a suitable benchmark against which to evaluate the investment or broader market described herein. Investors cannot invest directly in an index.
* Commentary regarding the returns for investment indices and categories do not reflect the performance of MBL Wealth, LLC or its clients. Historical performance results for investment indices and/or categories generally do not reflect the deduction of transaction and/or custodial charges or the deduction of an investment-management fee, the incurrence of which would have the effect of decreasing historical performance results.
* Although certain information has been obtained from sources believed to be reliable, we do not guarantee its accuracy, completeness or fairness. We have relied upon and assumed without independent verification, the accuracy and completeness of all information available from public sources. This material is not intended to present an opinion on legal or tax matters. Please consult with your investment advisor or financial planner as applicable.
* Investment Advisory Services are offered through MBL Wealth, LLC, a Registered Investment Advisor. Securities are offered through M Holdings Securities, Inc., a registered broker/dealer, member FINRA/SIPC. MBL Advisors Inc. is independently owned and operated. #5441120.2